
1. Introduction
Technological advancements have transformed the world of finance. Digital finance, the delivery of financial services using mobile phones, the internet, or cards (Manyika et al., 2016), is an easy-to-use innovation that can revolutionise the world. It includes various financial products, services, and innovative ways of interacting and communicating with customers (Gomber et al., 2017). There is no standard definition of digital finance. However, it commonly refers to all the products, services, infrastructure, and technology that enable firms and individuals to access savings, payments, and credit facilities online without physically visiting a bank branch (Ozili, 2018). It reduces the cost of financing intermediaries such as banks and fintech firms and is more affordable for customers than traditional banking services (Durai & Stella, 2019). Digital finance benefits users, service providers, the government and the economy by improving access to finance across socioeconomic strata. This can increase financial inclusion and national income (Ozili, 2018). The increased and wide usage of digital finance can potentially increase the global gross domestic product (GDP) to 6% by 2025 (Manyika et al., 2016).
Financial inclusion refers to organisations’ and individuals’ affordable access to valuable financial products and services (Grohmann et al., 2018). Sarma (2016) defines financial inclusion as ensuring access, readiness, and usage of formal financial products and services. Thus, the focus is on access and usage of financial products and services for all. Financial inclusion has a massive socio-economic impact. World Bank is taking several initiatives in developing countries to increase financial inclusion, considering its role in poverty alleviation. It has also been stated that more profound levels of financial inclusion are directly associated with a reduction in income inequality and higher GDP growth rates (Ravi, 2019). Globally, digital finance is considered a means for promoting financial inclusion as it can magnify the reach of financial products and services using innovative technology and significantly reduce the cost of financial products and services. The transformative developments in the financial sector are expected to significantly improve and expand individuals’ and firms’ access to finance, leading to financial inclusion (Ozili, 2018). The main goal of providing financial services digitally is to contribute to financial inclusion objectives in developing countries (United Nations, 2016). The digital finance system has significantly reduced the gap between the banked and unbanked populations in most developing countries and is a powerful tool for handling financial exclusion (Hasan et al., 2022).
Micro, small, and medium enterprises (MSMEs) are strategically crucial for inclusive economic growth and nation-building. Their contribution towards employment generation, socio-economic development, and GDP has been widely acknowledged (Pawar & Sangvikar, 2019; Shofawati, 2019). India has a total of 63. 4 million MSMEs as of February 2023, of which 63.1 million units (approx. 99%) are micro units[1]. They contribute approximately 30% to the GDP and provide employment to close to 110 million people, of which 97% are in the micro sector (Hossain & Pathak, 2023). Most businesses in this sector are excluded from credit registries as they lack the information banks and financial institutions (FIs) require to assess their creditworthiness, reducing their chances of getting funds at an appropriate cost (Carriere-Swallow et al., 2021). The digital footprints created by digital transactions can help these units access formal financing from banks and FIs. As per Agyekum et al. (2022), the usage of digital technologies by MSMEs significantly improves their access to external financing, ultimately enhancing financial inclusion. Hermawan et al. (2022) have also identified a strong relationship between digital finance and financial inclusion in MSMEs. Considering the significance of MSMEs and micro units within them, the increased adoption of digital finance by micro-enterprises would benefit the units and the entire Indian economy by increasing financial inclusion.
Technology adoption benefits micro-units, but the adoption of digital finance for micro-units is limited (N. Sharma & Shastri, 2020). Digital financial services face tough challenges, with close to 60% of Indians relying on cash transactions (D’Souza & Ghosh, 2023) and currency circulation close to 13% of GDP, which is much higher as compared to other countries such as Brazil (4.1%), Mexico (5.7%), Russia (10%) etc. (Statista, 2024a). Earlier studies (Chin et al., 2022; Rastogi et al., 2021) have attempted to identify the factors affecting adoption of various digital financial services. However, very few studies consider both enablers and deterrents in the Indian context. (Jain & Raman, 2022). Further, existing studies (Ozili, 2018) have identified digital finance’s role in financial inclusion. However, they have also stated that digital finance and its impact on financial inclusion have not been addressed adequately in the literature (Rastogi et al., 2021). The studies have focused on MSMEs in general (Agyekum et al., 2022; Hermawan et al., 2022). but not specifically on micro units in the Indian context.
Thus, there is a lack of conclusive empirical evidence regarding the factors affecting the acceptance and adoption of digital finance among micro units in India. Limited literature was found on digital finance to build up the theory of its linkage to financial inclusion. The limited studies on digital finance service adoption by micro units in India have motivated the present study. The present study attempts to explain the key factors for micro units’ adoption of digital finance and the impact on financial inclusion in India. Further, there are several challenges in terms of infrastructure and regulatory issues that require government support (Chen et al., 2023). Extant literature has also supported the view that peer influence affects users’ perceptions and, ultimately, their actions in different settings (Persaud & Schillo, 2017). Also, owner characteristics play a significant role in adopting digital innovation in MSMEs (Trinugroho et al., 2022). In this backdrop, the following study objectives have been set: (a) to identify the factors affecting the adoption of digital finance amongst micro businesses in India; (b) to examine the moderating roles of peer influence and government support in promoting digital finance adoption in micro-businesses in India; and (c) to assess the impact of digital finance on financial inclusion.
The study focuses on enablers and deterrents for adopting a multi-theory approach to digital finance. The study proves empirically that a digital financial ecosystem helps in the financial inclusion of micro-units, which is this paper’s significant contribution. In this study, digital finance includes mobile banking, mobile wallet(apps), and internet banking. The financial inclusion in this study has been proxied by assessing saving behaviour and the access and availability of credit for micro units along with their usage following Agufa (2016) and Fungáčová & Weill (2015).
The research outcome will help practitioners and policymakers develop effective strategies for promoting digital finance adoption among India’s micro units. This study provides policymakers with a deeper understanding of the enabling factors and the deterrents affecting digital finance adoption in micro units so that it can be dealt with favourably for increasing financial inclusion. This study adds to the literature on digital finance adoption for academicians and researchers, aiming towards sustainable financial inclusion, particularly regarding micro units of MSMEs in an emerging economy like India. The rest of the section of the paper is organised as follows: Section 2 discusses the theoretical framework and conceptual model development. Sections 3 and 4 explain the methodological details and results of the study, respectively. Section 5 presents the discussion and highlights the study implications, and section 6 presents the concluding remarks.
2. Theoretical framework and conceptual model development
2.1. Theoretical framework
The present study attempts to identify the factors affecting digital finance adoption in micro-businesses in India from a multi-theory perspective by combining the Technology Adoption Model 3 (TAM 3) and Prospects Theory. Most studies on technology adoption related to finance have relied on theories of technology acceptance, which focus more on enabling factors from a technological perspective, and little focus has been observed on inhibiting factors (Gomber et al., 2017). Digital finance adoption encompasses a complicated interaction of enabling factors and inhibiting factors. This leads to exploring the factors affecting digital finance adoption from a multi-theoretical perspective.
Specialised models developed over the past three decades to examine the phenomenon of technology adoption fall mainly into two strands, the first being the Technology Adoption Model (TAM) proposed by Davis in 1989 and the second being UTAUT, the united theory of acceptance and use of technology proposed by Venkatesh et al., 2003. TAM originated from the theory of reasoned action (Fishbein & Ajzen, 1977) and is presently in the third stage of its evolution through TAM 2 (Venkatesh & Davis, 2000) and is popularly known as TAM 3 (Venkatesh & Bala, 2008). The UTAUT model resulted from a quest to synthesise and harmonise several theories and technology adoption models developed over time. The present study uses the TAM 3 model for multiple reasons: First, it is a well-established and widely accepted model for predicting the adoption of new technologies (Kamal et al., 2020) and is more widely used than UTAUT (Ammenwerth, 2019).
Secondly, it is flexible and can be adapted to different technologies and contexts. This aspect is significant for understanding context-based comprehension about adoption behaviour for a specific technology (X. Zhang et al., 2022). However, TAM 3 leans towards enabling factors and does not focus on deterrents. Therefore, to holistically understand the factors affecting digital finance adoption, TAM 3 has been complemented with Prospect Theory (Kahneman & Tversky, 1979). Prospect theory helps in understanding people’s assessments in decisions involving risks and is often used to understand risks associated with the usage of technology (Senyo & Osabutey, 2020). The present study draws on the prospect theory to examine the impact of perceived risks on behavioural intention to adopt digital finance and estimate its correlation with trust following Nguyen et al. (2016).
2.2. Development of conceptual model
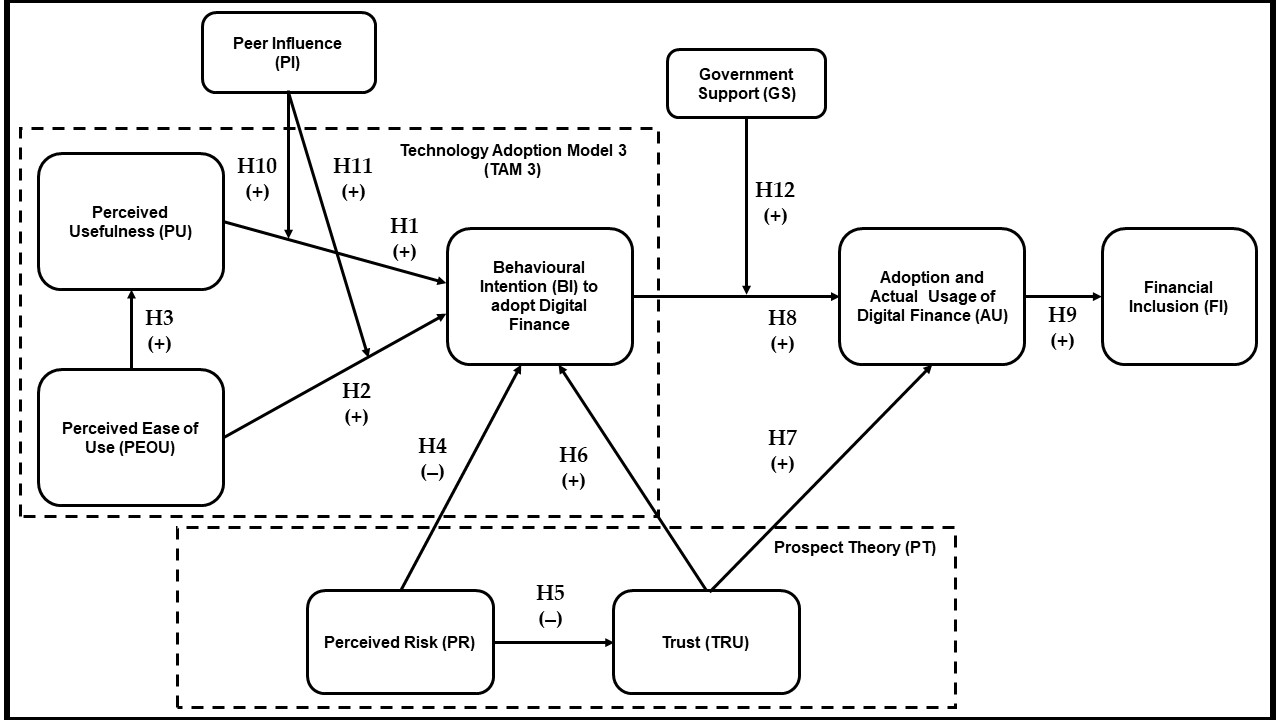
The proposed conceptual model has been developed based on the constructs from TAM 3 and Prospects Theory. These theories offer unique constructs complementing each other, with TAM 3 focusing on drivers for technology adoption and prospect theory primarily on deterrents. Combining theories helps in understanding a phenomenon holistically (Fichman, 2004). Further, as per Krueger and Carsud (1993), exogenous variables influence the intention or intention-adoption relationship towards technology. Thus, a few relevant exogenous variables identified from the literature that consider the study context have been added. Existing studies (Persaud & Schillo, 2017; Venkatesh & Bala, 2008) have identified the role of peer influence as an intervening variable in technology adoption. Hence, this study also considered peer influence to be an intervening variable. Further, considering the significant role of the government at every level in financial digitalisation, government support has been explored as a moderator between intentions and the adoption of digital finance. This will help in a detailed exploration of the factors affecting digital finance adoption in micro units towards deepening financial inclusion in the Indian context. The present study combines perceived usefulness, perceived ease of use, behavioural intention, adoption, and actual usage from TAM 3 with perceived risk and trust from prospect theory. Further, the study investigates the moderating role of peer influence and government support in improving micro-unit adoption of digital finance.
(a) Perceived usefulness (PU)
The extent to which a user believes that a specific system will improve his ability to perform a particular task is perceived usefulness (Davis, 1989). Existing studies (Al-Emran et al., 2020; S. Sharma & Saini, 2022) have empirically concluded that perceived usefulness significantly affects behavioural intention towards technology adoption. When owners of micro business units perceive that adopting and using digital finance services can improve their operational performance, they tend to adopt them. In this context, the following hypothesis is being framed:
H1: Perceived usefulness (PU) positively affects the behavioural intention (BI) to adopt digital finance.
(b) Perceived ease of use (PEOU)
Perceived ease of use refers to assessing the human effort required for using a new system (Davis, 1989). If people believe a particular technology is simple and not complicated, they will try it (Venkatesh et al., 2003). Several studies (Al-Emran et al., 2020; Yim et al., 2019) empirically identified PEOU as having a significant impact on behavioural intention.
H2: Perceived ease of use (PEOU) positively affects the behavioural intention (BI) to adopt digital finance.
It is expected that PEOU will lead to effort savings and more work for the same quantum of effort (J. B. Kim, 2012). This leads to the enhancement of PU, which is empirically supported by several studies (J. B. Kim, 2012; K. J. Kim & Shin, 2015). In this background, PEOU can be considered as an antecedent of PU. This discussion leads to the development of the following hypotheses:
H3: Perceived ease of use (PEOU) positively affects perceived usefulness (PU).
(c) Perceived risk (PR)
Risk perception is the uncertainty or anxiety about the possible adverse outcomes (Mandrik & Bao, 2005). Several existing studies (Slade et al., 2015; Xie et al., 2021) have found a negative impact of PR on behavioural intention. By nature, financial services are risky, which becomes more pronounced with digitalisation (Malaquias & Hwang, 2016). The existing studies about the digital environment have identified different types of risks. For example, Featherman and Pavlou (2003) state that the digital environment leads to financial and privacy risks and time opportunity costs. As per Kim et al. (2008), the most significant risk associated with digital transactions is information risk related to the security and privacy of transactions. In the present study of digital finance adoption, perceived risk can be aligned most with the information and financial risk. Existing studies (Malaquias & Hwang, 2016; Meyliana & Fernando, 2019) have supported the notion that the perception of the risks in digital financial transactions negatively influences users’ trust. This leads to the following hypotheses:
H4: Perceived risk (PR) negatively affects the behavioural intention (BI) to adopt digital finance.
H5: Perceived risk (PR) negatively affects the trust (TRU).
(d) Trust
Trust refers to the subjective belief that the parties involved in a transaction will fulfil their respective obligations (Mayer et al., 1995). Trust involves believing in technology (process) and people (Rempel et al., 1985). Trust is a significant variable in digital financial transactions, considering the virtual nature and issues about data privacy and the financial nature of these transactions (Fusaro et al., 2002; Jain & Raman, 2022). Extant studies (Penney et al., 2021; Senyo & Osabutey, 2020) support a significant positive impact of trust on behavioural intention and the adoption of digital technologies. This leads to the following hypotheses:
H6: Trust (TRU) positively affects the behavioural intention (BI) to adopt digital finance.
H7: Trust (TRU) positively affects the adoption of digital finance (AU).
(e) Behavioural intention (BI)
This is a significant variable in the TAM 3 model, leading to actual adoption and usage. Users need to have intent first and then only go for actual usage. A positive intention eventually leads to action, as demonstrated empirically in extant literature (Chatterjee et al., 2021; Hu et al., 2019). Given this, the following hypothesis has been framed:
H8: Behavioural intention (BI) positively affects the adoption of digital finance (AU).
(f) Adoption of Digital Finance (AU) and Financial Inclusion (FI)
Digital finance in developing countries is a significant tool for increasing financial inclusion as it can lead to greater access and usage of formal financial services (Herdinata, 2020; Manyika et al., 2016; Ozili, 2018). Financial inclusion is generally measured by assessing the proportion of people accessing and using formal financial services (Klapper et al., 2016). In India, customers with an excellent digital footprint can be considered for credit by banks and financial institutions even without documentation (Raj & Upadhyay, 2020). This leads to the following hypothesis:
H9: The adoption of digital finance (AU) positively affects the financial inclusion (FI) of micro business units in India.
(g) Peer influence (PI)
Peer influence is viewed as a significant influence in pursuing or not pursuing a particular course of action and is demonstrated empirically concerning technology adoption in several prior studies in varying settings (Persaud & Schillo, 2017; Suki & Suki, 2019). The following hypothesis has been developed to study the moderating effect of PI:
H10: Peer influence (PI) has a positive moderating effect on the linkage between perceived usefulness (PU) and behavioural intention (BI) to adopt digital finance.
H11: Peer influence (PI) has a positive moderating effect on the linkage between perceived ease of use (PEOU) and behavioural intention (BI) to adopt digital finance.
(h) Government support (GS)
Government support is crucial in technology adoption (Alrahbi et al., 2021; Chen et al., 2023). In India, the government and the Reserve Bank of India (RBI) build digital infrastructure for digital services. Further, governmental support in the form of legislation and regulations generates confidence among users (Vörös et al., 2021) and can play a significant role in turning positive intentions into adoption. In this context, government support can act as a moderator between behavioural intention and adoption, and this leads to the following hypothesis:
H12: Government support (GS) has a positive moderating effect on the linkage between Behavioral intention (BI) and the adoption of digital finance (AU).
Hence, considering the hypotheses stated above, the following conceptual model is proposed in Figure 1.

3. Research methodology
The Partial Least Square-Structural Equation Modelling (PLS-SEM) technique has been applied for data analysis using SmartPLS-v4. PLS is a suitable technique for theory development and predictive analysis in situations of high complexity but with little theoretical support (Ishak & Newton, 2018). Considering the exploratory nature of the study and the underdeveloped theoretical information about the factors affecting digital finance adoption, SEM is an appropriate method as compared to conventional econometric techniques. Further, PLS-SEM has been used due to its advantages, such as relaxation in terms of normality assumptions (J. Hair Jr. et al., 2021; Richter et al., 2016), the capability of handling complex relationships, and its usefulness in measuring single-item constructs (Astrachan et al., 2014). Also, PLS-SEM is more appropriate for examining the effect of moderating variables (Limayem et al., 2007).
3.1. Questionnaire development
A structured questionnaire was developed to identify the factors that have a bearing on the adoption of digital finance by micro units in India. The questionnaire consisted of two sections. The first section included demographic variables such as gender, age, and nature of business. The second section included all the constructs. Scales used in prior studies have been adopted for measuring the various constructs, as shown in Table 1. Appendix 1 presents the items in detail in the form of measurements. A 5-point Likert scale ranging from 1 for strongly disagree to 5 for strongly agree has been used for quantifying the responses. This study uses a 5-point Likert scale to increase the response rate and improve the quality of responses (Buttle, 1996). Following Chatterjee et al. (2021), the moderators’ peer influence (PI) and government support (GS) have been measured using single items. Single-item constructs are useful when items of the originating scale are found to be semantically redundant (Diamantopoulos et al., 2012) and the selected single item fully describes the construct given the study domain (Verster et al., 2021).
Pilot testing with 40 respondents was done to establish the content validity and reliability of the research instrument. Based on the pilot study, the questionnaire was minorly restructured for better clarity. The measurement items were subjected to content validity and internal consistency tests per the recommendations of Nunnally & Bernstein (1994) and Creswell (2006).
3.2. Sample design and data collection
This study is based on a primary survey and adopts a cross-sectional research design for collecting primary data. The micro-units in the cities of Mumbai and Ahmedabad in India are the target population here. Considering the needs of the study, respondent units should have a bank account, a device (mobile or laptop), and an internet connection. Respondent units have been selected following the convenience sampling method, and initial questions in the questionnaire were designed to confirm their eligibility. The recommended sample size is at least ten times the number of items in the study (J. Hair Jr. et al., 2021). Considering the total number of items in the study is 25, the required sample size is 250. The researchers directly distributed structured questionnaires to the micro-unit owners and/or managers.
A total of 400 questionnaires were administered (200 per city). The data was collected over five months, from July 2023 to December 2023. In total, 339 responses (168 + 171) were obtained (84.75%). Of these, 13 responses were incomplete and therefore excluded, resulting in 326 (81.5 %) usable responses. A chi-square test was performed to check the probable difference between the data as the sample data was obtained from two different cities. No considerable difference was found based on the results. A t-test was performed considering the first 50 and last 50 respondents to further verify the probable non-response bias. No significant differences were observed based on the results (p < 0.05), indicating that there was no non-response bias (Armstrong & Overton, 1977). It is essential to check for possible common method bias (CMB) in those situations where the dependent and independent variables have been captured using the same measurement method (Kock et al., 2021). Harman’s single-factor test has been conducted to detect CMB. The test result showed that the first factor accounted for 34.2% of the variance, which is less than the cutoff value of 50% (Podsakoff et al., 2003), indicating the absence of CMB.
4. Results
Table 2 presents a demographic profile of the respondents. Thereafter, as per the recommendation of Anderson and Gerbing (1988), a two-step approach was followed. The first step was to examine the measurement model to test the survey instrument for its reliability and validity. This was followed by evaluating the structural model for hypothesis testing.
4.1. Demographic profile
The frequency analysis (Table 2) reveals that 180 respondents (54.91%) are males, and 147 respondents (45.09 %) are females, with the majority of the respondents (77.91%) over 30 years of age. Respondents are engaged in manufacturing (44.48%), trading (9.81%), and other services (45.71%). Manufacturing includes paper bags, pickles, furniture, wood products, etc. Trade includes grocery stores, vegetable stores, etc. Other services include catering units, beauty parlours, etc.
There is a deviation in the proportion of the manufacturing sector, trade and service sector in the sample as compared to the actual population in terms of numbers, where it is approximately 31% manufacturing units and 69% in trade and other services, as per the recent statistics (IBEF, 2023). This deviation is due to the relatively higher response from the manufacturing sector and a lesser from the trading and service sectors. Regarding gender-wise bifurcation, the proportion of males in the sample (54.91%) is more significant than that of females (45.09%). Males dominate micro-entrepreneurial activities in India, with approximately 79% ownership, compared to females, 21% (Statista, 2024b). The women are overrepresented in the sample due to their enthusiastic participation in the survey compared to men. This is also reflected in the 44.7% proportion of responses from other services, which typically includes catering, beauty parlours, among others and pickle making in the manufacturing sector.
4.2. Measurement model assessment
Internal consistency, convergent validity and discriminant validity were assessed to examine the measurement model. Internal consistency was assessed using Cronbach’s alpha (CA) and composite reliability (CR). CR and CA of all the latent variables are more significant than the critical values (CR > 0.7, CA > 0.8), as per Nunnally and Bernstein (1994), indicating an excellent internal consistency. Since the factor loading of all the items is more significant than 0.7, none are dropped from the final model. Convergent validity is assessed by factor loading of each item and average variance extracted (AVE). AVE estimates for each construct should be greater than 0.5 (Fornell & Larcker, 1981), and the factor loadings of each item should exceed 0.7 (J. Hair Jr. et al., 2021) for a satisfactory convergent validity. As seen (Table 3), satisfactory convergent validity has been observed for all the constructs with Rho_A values between CA and CR.
Two criteria were employed to verify discriminant validity: the Fornell and Larcker criteria and the Heterotrait-Monotrait (HTMT) ratio. The discriminant validity is established if the square roots of the AVE of each construct are more than the corresponding correlation coefficient with other constructs (Fornell & Larcker, 1981). The result, as seen in Table 4, establishes the discriminant validity. The HTMT ratio was also calculated to supplement and verify the Fornell and Larcker criteria. As seen in Table 5, the HTMT ratio is less than the threshold of 0.85 between any of the two variables, confirming discriminant validity (Henseler et al., 2015).
4.3. Structural model evaluation
The structural model was evaluated using multicollinearity examination, followed by examining the coefficient of determination (R2) (Cohen, 2013). Multicollinearity was assessed using variance inflation factors (VIF) between the latent constructs (J. F. Hair et al., 2019). The VIF values of all the constructs are below 5, as seen in Table 6, ensuring the lack of multicollinearity (J. F. Hair et al., 2019).
The bias-correlated and accelerated bootstrapping procedure using 1,000 bootstraps has been performed to assess the significance of constructs (J. Hair Jr. et al., 2021). Table 7 shows the path coefficient for direct effects, and Table 8 presents the path coefficients covering moderators. Table 9 presents the value of R2 for endogenous constructs and Stone-Geisser’s Q² statistic (Geisser, 1975; Stone, 1974). R2 values and Q² statistics show the model’s explanatory power and predictive relevance, respectively (J. F. Hair et al., 2019; Kline, 2023).
As presented in Tables 7 and 8 and Figure 2, the study’s results confirm the hypotheses H1, H2, H4, H5, H8, H9, H10, H11, and H12, whereas H3, H6, and H7 were rejected. Except for PR, all the variables positively impact digital finance adoption.
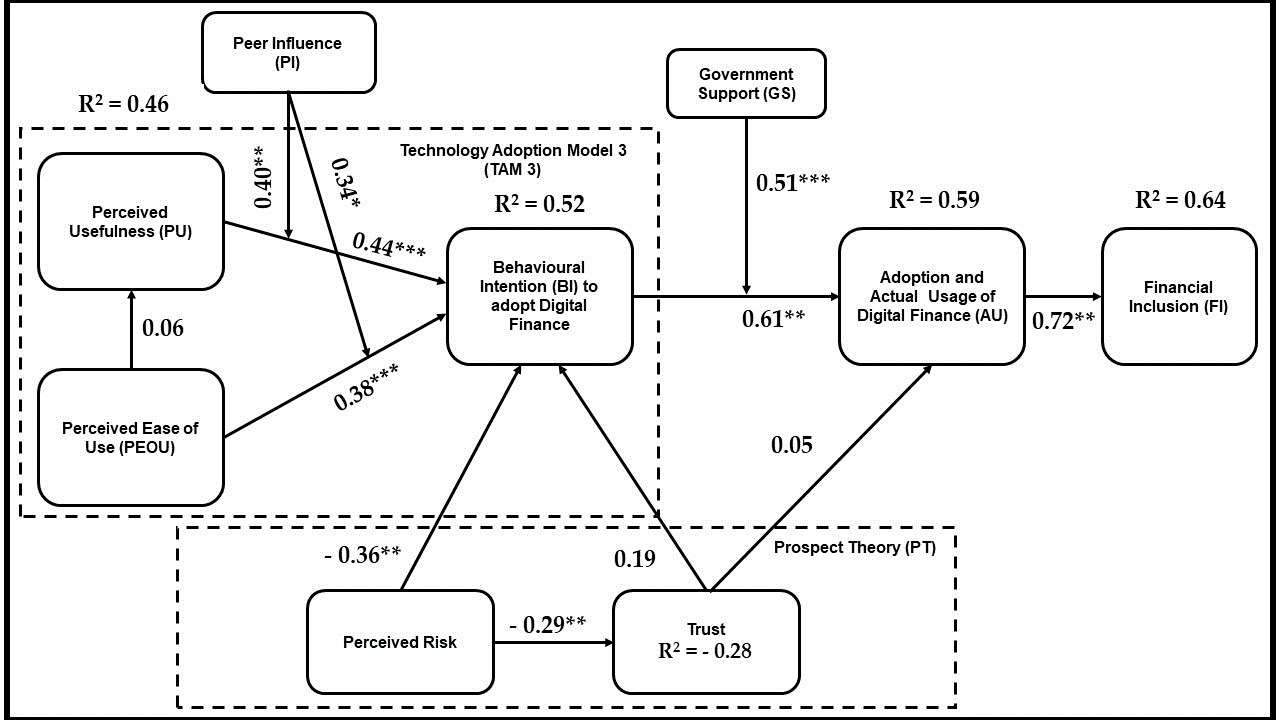
The moderating effect of the variable on the hypothesised linkages is significant, as seen from Table 8.
In general, R² values around 0.75, 0.50, and 0.25 are substantial, moderate, and weak, respectively, in depicting the explanatory power of the variables, whereas Q² values greater than zero are meaningful, indicating high predictive relevance of the variables (J. F. Hair et al., 2019). However, Table 9 shows that the model can explain 64% variance (moderate to substantial), 59% variance (moderate), 52% (moderate) and 46% (moderate) in financial inclusion, actual usage, behavioural intention, and perceived usefulness of digital finance respectively by various independent variables considered. Prospect theory variable risk explained 28.2% (weak) variance in trust. Furthermore, all the Q² values were positively indicative of high predictive relevance (Gefen & Straub, 2005; J. F. Hair et al., 2019).
The post-analysis in Figure 2 displays the results of the statistical model, including the specific calculations and findings.
5. Discussions
The study findings are encouraging, and the proposed model has good explanatory power. The results of the study support nine and reject three hypotheses. The technology acceptance model supports the hypothesis that PEOU leads to PU. However, in the present study, this hypothesis has not been supported with a low path weight and ‘ns’ as a significance level. This contradicts several existing studies (K. J. Kim & Shin, 2015; Meyliana & Fernando, 2019). Further, the hypotheses that TRU leads to BI and AU are also not accepted in the present study, contradicting several extant studies on technology adoption (Penney et al., 2021; Senyo & Osabutey, 2020). However, the goal of the study is FI, and this can be interpreted by the mediating variable AU to the extent of 64% (R2=0.64). This shows that the model is effective, with an excellent explanatory power of more than 60%. The rest of the hypotheses have been supported as expected and conforming with existing studies (Chatterjee et al., 2021; Hu et al., 2019).
Another important observation is the significant influence of perceived risk on behavioural intentions to adopt digital finance. This is in accordance with several existing studies (Meyliana & Fernando, 2019; Slade et al., 2015) and highlights the applicability of TAM models with risk constructs. The four exogenous variables, i.e., PU, PEOU, PR, and TRU, have explained the endogenous variable BI to the extent of 52% (R2=0.52). The linkage between the mediating variables BI and AU and between TRU and AU shows that AU can interpret BI and PRU to the extent of 59 per cent (R2= 0.59). In the present study, PI and GS were considered moderators. With such considerations, the study provides a successful model with a high predictive power of 64%.
The study provides new insights into various factors impacting digital finance adoption in micro units in India. It proves empirically that digital finance leads to financial inclusion, which is the significant contribution of the study. Studies focusing on financial inclusion are significant, considering they lead to poverty reduction and economic development.
6. Implications of study
The current study offers various practical and academic implications based on the findings.
6.1. Practical implications
This study has several noteworthy practical implications. First, the study can aid practitioners in improving their understanding of the benefits and risk perceptions of micro units about digital finance. This will help develop strategies that reduce risk and its perception, promoting digital finance adoption among micro units. Secondly, the study identifies a significant moderating role of peer influence and government support in promoting digital finance. Practitioners have a key takeaway from this and can use peer influence to enhance behavioural intentions to adopt digital finance. One strategy can be to ensure that the success stories of the business units are promoted in the respective business circles. The government should aim to ensure the availability of digital platforms and services cost-effectively and ensure regulatory due diligence.
6.2. Academic implications
The study also provides significant academic contributions. First, the study adopts a multi-theory approach, integrates TAM3 and prospects theory, and proposes a powerful digital finance adoption model for micro units in India. Second, the present study accounts for drivers and deterrents and asserts that antecedents to behavioural intention to adopt digital technology include risk considerations. Third, the study extends the generalisability of the TAM 3 model to the process of digital finance adoption and adds value to the existing body of knowledge. The study provides theoretical support for promoting digital finance, considering its impact on the financial inclusion of small business units in emerging economies like India.
7. Concluding remarks
The study aims to explore the factors affecting digital finance adoption amongst micro businesses in India and examine the moderating roles of peer influence and government support. The study also aims to assess the impact of digital finance on financial inclusion. The study concludes that perceived usefulness, perceived ease of use, and perceived risk significantly impact the behavioural intention to adopt digital finance. A significant moderating effect of the chosen moderators (i.e., peer influence and government support) has also been observed. Further, it is empirically concluded that adopting digital finance by micro business units ultimately leads to financial inclusion.
Though the study follows a rigorous validation procedure, some limitations must be acknowledged. The sample showed a deviation from the actual population regarding the proportion of manufacturing, trading, and other services and gender. This was due to the higher responses from the manufacturing sector and other services and fewer from the trading sector. In terms of gender, females responded more than males. The present study focuses only on constructs from TAM3 and prospects theory. Future studies can extend the scale by taking more constructs into account. The study included micro units located in Tier 1 cities in India. Future studies can expand the scope and include the units in other smaller cities and rural settings. Although digital finance can be discussed from various perspectives, the present study limited itself to mobile banking, internet banking, and mobile apps. This reduces the scope of the study. This study has not analysed the impact of demographic characteristics such as age and gender of the owner/manager of micro units. Future studies can consider exploring this aspect. Further, India is an emerging economy so that social idiosyncrasies might reduce the applicability of findings for developed nations. Future studies can explore the impact of antecedents in the context of developed and emerging economies. A cross-national study can also be conducted to examine the role of cultural and geographical factors in the adoption of digital finance. Further, the study focuses on the perspective of one of the end users (micro units); however, the digital finance setup includes several stakeholders, such as regulators, banks/ financial institutions, fintech providers, etc. Further, future studies can also focus on their perspectives to gain valuable insights.