


Introduction
A strategic group is a cluster of firms in an industry that apply similar strategies to attack a market segment (Söllner & Rese, 2001), which forms “a small subset of direct rivals” (Carroll & Thomas, 2019, p. 505). Related to strategy, firms in a strategic group have similar market views, which often prompts a common approach (Söllner & Rese, 2001). For example, consider the restaurant industry. The fast-food restaurant strategic group may apply a low-cost strategy and efficient service to serve customers seeking quick and affordable meals. However, the high-end restaurant strategic group may seek to differentiate its meals, seeking to serve customers willing to pay more for an élite experience. From its origin (Hunt, 1972), many research articles have addressed the strategic group concept (see the table in our literature review).
Strategic group research has primarily addressed two key research questions: (1) Do strategic groups exist apart from merely appearing as a statistical artifact? And (2) does strategic group membership affect firm performance? (Barney & Hoskisson, 1990; DeSarbo & Grewal, 2008; Dranove et al., 1998). Many studies have explored the relationship between strategic groups and performance, but the findings are mixed (Cool & Schendel, 1988; Dess & Davis, 1984; Gordon & Milne, 1999; Lawless et al., 1989; Zúñiga-Vicente et al., 2004).
We addressed two research questions sequentially by 1) comparing and subjectively confirming the results from multiple established statistical clustering techniques that place the firms into natural groupings, and 2) applying Data Envelopment Analysis (DEA). DEA is a data-driven technique that has been used extensively in efficiency analysis (Emrouznejad et al., 2008). Clustering allows for firms to be organized into naturally-formed groups in a multivariate space, in this case their selection of products/service and processes, based on similarity. There are a myriad of ways that observations can be considered similar, and those techniques that we utilized are more further explained in the Methods section. The main advantage of DEA is its sole reliance on the data with no underlying assumptions about the form of the data, hence no major concerns about sample size. Additionally, DEA presents each firm with its best “efficiency” score based on the ratio of its weighted outputs to its weighted inputs; the weights being mathematically derived by the technique to provide the maximal score possible for that firm. In essence, this application of DEA allows each firm to best present itself among its peers in its performance from its strategic inputs. This conversion of strategic positioning (low-cost or differentiation) to performance measures is relatively new in DEA applications and strategic group research.
Our DEA findings suggest that specific generic strategies are more effective in different strategic groups. This aligns with the early thinking that strategic group leaders apply similar cognitive thinking approaches, which may form a foundation for strategic group theory (Lant & Baum, 1995; Reger & Huff, 1993; Spencer et al., 2003). For instance, low-cost leaders seek to provide the most efficient printing services at the best price, whereas printers who differentiate provide a unique product based on customer needs and analysis – Porter’s (1981) low-cost and differentiation theories applied. In the literature review, we discuss how strategy formulation, strategies, and past study findings apply specifically to the printing industry.
We contribute to the strategic group literature in the following ways. First, we support the existence of strategic groups, this time in the printing industry. As we discuss in the opening of our methodology section, printing companies have transitioned significantly from applying similar printing processes (printing presses, folders, and bindery equipment) to produce similar products (calendars, maps, brochures, books, labels, catalogs, magazines, and others) to a very diversified industry facing printed product substitutes (digital media) and printing production technology development (such as digital printing and others). Therefore, the printing industry is an adequate place to explore strategic groups. Second, we identify printing industry strategic groups and confirm they are logical from an industry point of view. In other words, the groups identified “make sense.” Third, we support previous findings of performance differences among strategic groups. Finally, our largest contribution is the novel approach of employing DEA, which allows for the comparison of multiple firm output performance measures with strategic positioning inputs to assess the ability of an organization to effectively convert the latter into the former. Our DEA findings suggest a specific generic strategy is more effective for some strategic groups than for other strategic groups we identified within the printing industry.
Literature Review
As we explore the presence of strategic groups in the printing industry, how performance varies among those strategic groups, and how effective generic strategies differ among strategic groups, our literature review takes the following path. We open by describing the origin of strategic group research, which provides a foundation for identifying strategic groups. We next review research about benchmarking among strategic group members, which points us to comparing performance between strategic groups. Lastly, we share research about cognitive thinking among the leaders of strategic group member firms, which points to making effective strategic group generic strategy decisions. Given that we explore low-cost and differentiation generic strategies, we discuss those concepts in our last literature review section.
Strategic Group Research Origins
The foundation of strategic group theory is based on firms pursuing similar strategies that are subsequently grouped within similar niches – for example, retail stores might be classified as bargain hunters, big box, specialty, or high-end. In his analysis of how firms within the home appliance industry are categorized, Hunt (1972) introduced the strategic group concept (Nath & Gruca, 1997), which suggested that clusters of firms in an industry follow a similar strategy. More recently, Carroll and Thomas (2019) described strategic groups as logical clusters of organizations that have “a small subset of direct rivals” (p. 505). Strategic group members share similar views, and these views coincide within specific market segments (Söllner & Rese, 2001). More recent approaches include definitions of strategic group membership with variables like geolocation, business category, and brand (Jin et al., 2024). Researchers have explored strategic groups as a research topic and have used strategic groups to analyze industries’ competitive structure (Barney & Hoskisson, 1990).
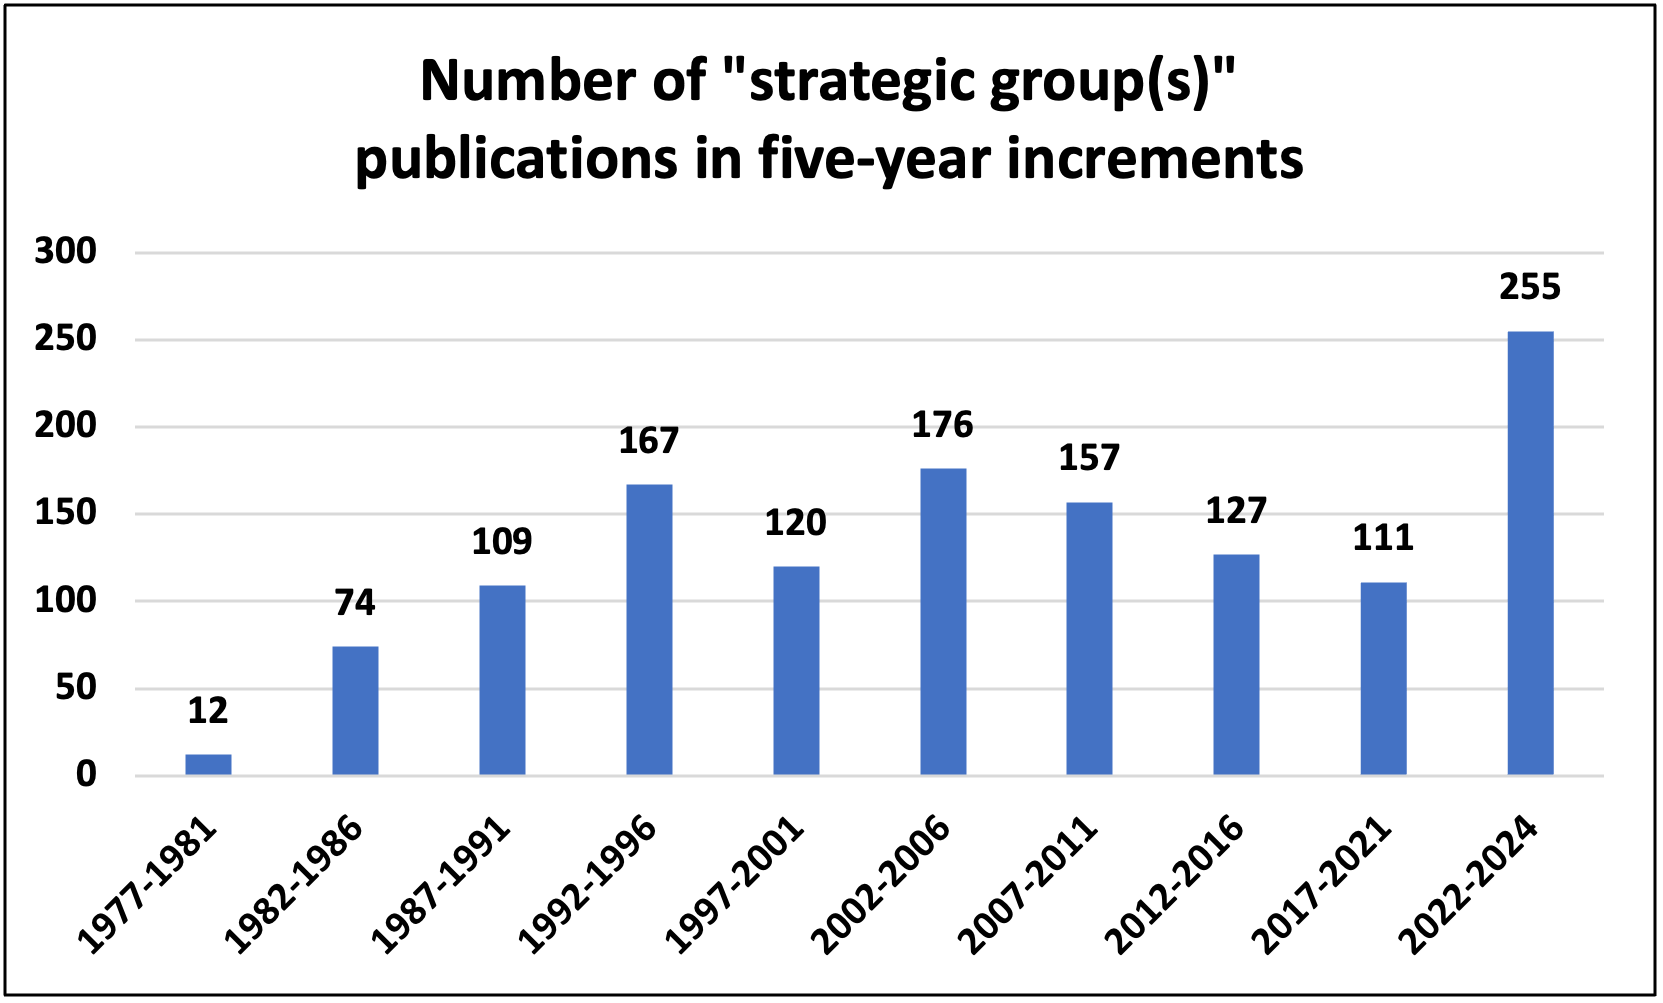
To see the extent of strategic group research, we searched Google Scholar for articles with “strategic group” or “strategic groups” in the title over five-year increments. Figure One illustrates our findings. It appears the “strategic groups” topic has drawn growing research interest over recent decades. Indeed, the highest number of articles appears in the 2022-2024 increment, which represents the recent three years.

Strategic group research has primarily addressed two key research questions: (1) Do strategic groups exist apart from merely appearing as a statistical artifact? And (2) does strategic group membership affect firm performance? (Barney & Hoskisson, 1990; DeSarbo & Grewal, 2008; Dranove et al., 1998). Without empirical support for the existence of strategic groups and their effect on firm performance, previous management researchers considered abandoning the strategic group concept altogether (Barney & Hoskisson, 1990; Dranove et al., 1998). Some proposed that researchers should study strategic groups longitudinally to learn whether group membership affects firm performance (Zúñiga-Vicente et al., 2004).
Scholars applied industrial organizational economics (IOE) to view intra-industry competition (Barney & Hoskisson, 1990). According to IOE, firms in an industry with a common external environment are homogeneous, and firm leaders make idiosyncratic strategic decisions (Barney, 1986; Porter, 1981). In contrast, the strategic group concept views an industry through a lens of both external and internal environmental factors (opportunities, threats, strengths, and weaknesses), forming a heterogeneous view of an industry with homogeneity among firms within strategic groups (Barney & Hoskisson, 1990; Porter, 1981). Homogeneity can occur through low-cost strategy, differentiation strategy, distribution channels, vertical integration, brand recognition, or other factors. Many studies have explored the relationship between strategic groups and performance, but the findings are mixed (Cool & Schendel, 1988; Dess & Davis, 1984; Gordon & Milne, 1999; Lawless et al., 1989; Zúñiga-Vicente et al., 2004). Moreover, some propose imperfect competition situations exist where members of a strategic group can exercise control over who enters their domain space through mobility barriers, firm reputation, or price (Cattani et al., 2017).
Strategic Group Benchmarking
Organizations in the same strategic group may benchmark one another and adjust their behaviors accordingly. Panagiotou (2007) explains that “. . . strategic groups are these firms in an industry pursuing similar positioning strategies (differentiation or cost leadership) in their markets (broad or niche in scope) and sell comparable products and services to the same or similar target group(s)” (p. 1597). Benchmarking allows firms to adjust their strategy to maintain or exceed rivals’ performance within their strategic group. Strategic groups also provide comparative references where members observe what other group members do; in other words, they ask, “What are we doing and how are we doing compared to our peers?” Travel firms in Panagiotou’s (2007) study benchmarked against their own strategic group as well as other groups, such as potential new entrants.
Strategic group members look to the market leader for comparisons. Panagiotou (2007) argues that in the beginning stages of their life cycle, firms are more likely to benchmark a wider range of strategic groups. As a firm becomes more established, the less it can redeploy and reposition, restricting benchmarking to members of its own strategic group. The strategy of following one another can create problems, especially if the leader adopts a suboptimal strategy: “Yet, the same set of strategies continued by all, even when they began to realize the problems, they were creating for themselves in the future” (Panagiotou, 2007, p. 1612). When a dominant leader in a strategic group acquires other firms, all others may follow suit—even when integrating cultures within the acquired firms becomes increasingly clear.
Strategic Groups as Cognitive Communities
Barney and Hoskisson (1990) suggest that organizing mechanisms distinguishing sets of competitors from each other were formulated absent any theoretical premise. However, later research suggests that not only do strategic groups exist, but they are the result of managers’ thought processes that translate into actions that distinguish firm groupings. Instead of an artifact of statistical analysis, strategic groups are abstractions in managers’ minds that manifest through beliefs and subsequent behaviors of firms acting in tandem (Nath & Gruca, 1997).
Mas-Ruiz and Ruiz-Moreno (2017) suggest that strategic group research has evolved from a rudimentary study of within and between-group differences to an analysis of the competitive behavior of groups. For instance, Nath and Gruca (1997) validated the existence of cognitive communities through survey data. Using ANOVA, they delineated five strategic groups in the hospital industry that were differentiated on dimensions of market share and occupancy. Through a triangulation multi-trait, multi-method approach, Nath and Gruca found that there was some convergence among the following: (1) factor analysis/clustering of archival data, (2) pan-dimensional scaling of industry attributes, and (3) managerial identification of similar and dissimilar competitors. Because managers have access to similar industry information, they continually engage in cognitive structuring that results in a strategic group.
Dranove, Peteraf, and Shanley (1998) argue that strategic groups occur “. . . as a byproduct of firms taking the expected reactions of others into account” (p. 1033). They assert that managers can take explicit behaviors, such as direct collusion to alter prices, jointly sponsoring advertising, benchmarking among firms, agreeing to invest as a group in technology, or jointly conducting research and development, or that managers can take implicit behaviors – “The key to each of these mechanisms is that firms base their own decisions and actions on their observations of others in the group” (p. 1032).
The fact that managers consider themselves part of a competitive enclave separates strategic groups from one another, and this tendency reflects the strategic groups theory that Barney and Hoskisson (1990) suggested must exist. In terms of cognitive structuring, studies have demonstrated that differences in strategic groupings are not merely artifacts of mathematical modeling, such as cluster analysis administering different algorithms, but rather the result of actions and behaviors that create imperfect competition. Spencer, Peyrefitte, and Churchman (2003) examined the mental maps of managers in the hospital industry, building on previous findings of similarity between cognitive groupings. They found objective indicators of performance that showed firms within a strategic group were more alike on objective measures of strategy and subjective managerial beliefs than firms in other cognitive groupings. Furthermore, managers’ cognitions were not only reflected in their respective groups; their thought processes served to create the groups, due to coordination and mimicry (Lant & Baum, 1995). “Top managers of firms holding different strategic positions may see their competitive worlds differently, hence mental maps should diverge” (Spencer et al., 2003, p. 207).
Actions among firms in a strategic group are often recursive in that managers’ perceptions of their position within their strategic group affect their subsequent behavior. They continually monitor competitors they deem similar and make adjustments, especially if that competitor is considered an industry leader. Therefore, industry leaders’ behavior may affect others within their strategic group. Because of this continual comparison, research has shown there is less rivalry between strategic groupings than among members of a specific strategic group (Peteraf, 1993).
Social learning theory suggests that people, or in this case firms, learn from observing others’ actions. Cognitive strategic group theory posits that firms concentrate their focus on member firms. Instead of examining archival documents to arrive at themes that could later be linked to objective firm attributes (like performance), Spencer, Peyrefitte, and Churchman (2003) surveyed hospital administrators to assess which hospitals they considered referents. The administrators noted that “. . . they considered these groups consistently when deciding which strategies to employ” (p. 217). Individual hospitals within referent groups were simultaneously considered by other hospitals as both “rivals” and “collaborators.”
Strategic groups may engage in “collective sensing” (Ng & Al-Shaghroud, 2018), a process whereby managers informally gather to assess opportunities and assess where they stand. This activity may occur within interlinked small businesses, whereby managers behave in a less constrained manner than a specific role in their company would dictate. Collective sensing is a way to informally strategize through sharing ideas among people from different hierarchical levels and functional backgrounds. Informal groups, over time, can develop a competitive advantage regarding their ability to sense auspicious investment opportunities. Ideas that are shared informally may be the most honest and impactful because managers do not feel the pressure of evaluation (Ng & Al-Shaghroud, 2018). The collegial back and forth enables ideas to emerge, and their synergy can stimulate action.
Research indicates that small business performance is positively impacted by organizational learning (the ability to use information and subsequently adapt), along with entrepreneurial orientation (risk-taking, proactivity, and innovativeness) (Pett et al., 2019). Organizational learning, like marketing and goal setting (which may occur within strategic groups) can positively impact organizational outcomes. For example, Oduro and Mansah-Williams (2023) found that small business financial performance (defined as profitability, ROE, ROS, ROI) was positively associated with marketing implementation; defined as the “adeptness of a business to transform its intended marketing policies and strategies into actions through allocating market-based resources and assets and monitoring its marketing performance (G. Liu & Ko, 2012).”
A Brief Review of Two Generic Strategies: Low-Cost and Differentiation Porter, M. E. (1981).
Michael Porter’s two primary generic strategies are low-cost and differentiation (Porter, 1981).
Low-Cost: Organizations that undertake a low-cost strategy can undercut rivals by increasing customers’ perceived value through reduced prices. Low-cost leaders may sustain price reductions by using existing capacity to produce more products (scaling). Another potential low-cost tactic is Just in Time (JIT) inventory practices. For example, Walmart requires its suppliers to attach RFID (radio frequency identification tags) chips to merchandise before shipping them to a Walmart store (CYBRA, 2022). Walmart’s efficient and effective supply-chain approaches help the firm to apply a low-cost strategy.
Ways to reduce costs also include backward and forward integration, which allows firms to enhance the value chain and reduce costs by eliminating a third party, which sometimes occurs out of necessity. An example is McDonald’s. When it opened its first franchise in Moscow Russia, McDonald’s sourced its own products to meet its quality standards. When organizations become their own distributor, like Disney, they further eliminate costs by reducing third-party markup. The disruptor of blockchain distributed ledger technology offers a highway to eliminate “middlemen,” and to reduce infrastructure as parties to a transaction interact directly with one another via smart contracts. Dell derived a low-tech variant of infrastructure elimination by selling personal computers directly to consumers.
In contrast to integration, a common cost-saving mechanism in a globalized market is outsourcing, where manufacturers and service providers reduce labor costs with qualified foreign personnel. According to NCESC.com, India is the second largest English speaking country in the world. According to a 2023 article in om/post/how-much-money-can-you-save-hiring-indian-vs-american-software-engineers Borderless AI, Indian programmers make three times less than U.S. programmers. Outsourcing through offshoring not only reduces costs but can expand the talent pool through greater patent development, innovation, and partnering with local firms (“Good Practice,” 2017; Herric, 2010).
Differentiation: Differentiation is a generic strategy where firms provide products and services that are set apart in the eyes of consumers. Differentiation strategies seek to create unique, inimitable value in the eyes of customers. Differentiation strategies include quality control processes, research, and innovation that result in what is perceived as a superior product, such as the following: INFINITI’s “relentless pursuit of perfection;” and the deployment of 3D printing (which enables customization and rapid product deployment on a mass scale); exceptional service, like AMICA insurance that has won the J.D. Power Award (based on customer survey data of customer satisfaction and product quality) ten years in a row (AMICA Earns, 2022); using exceptional ingredients, like ice cream manufacturers Häagen-Dazs and Ben & Jerry’s, and restaurants (like Bonefish Grill and La Madeleine); exceptional craftmanship (Amish furniture, luxury cars, boutique medical services) for which consumers are willing to pay a premium; and reputational brand value that has been developed over decades (like Pepsi and Coca-Cola). Lastly, conducting business in a socially responsible manner is a potential differentiator. For example, Starbucks purchases fair trade coffee where farmers are paid a living wage and use bean and shade-grown coffee to avoid rainforest erosion) can create differentiation in the eyes of consumers who are concerned about the environment and the ways that companies conduct their business.
Three Hypotheses
From above, an aim of early strategic group research was to explore if strategic groups existed merely as statistical artifacts (Barney & Hoskisson, 1990; DeSarbo & Grewal, 2008; Dranove et al., 1998). However, we saw exploring the statistical presence of strategic groups in the holistic printing industry as a legitimate starting process for this study. Given our printing industry knowledge, we expected to identify logical and statistically derived printing industry strategic groups. Therefore:
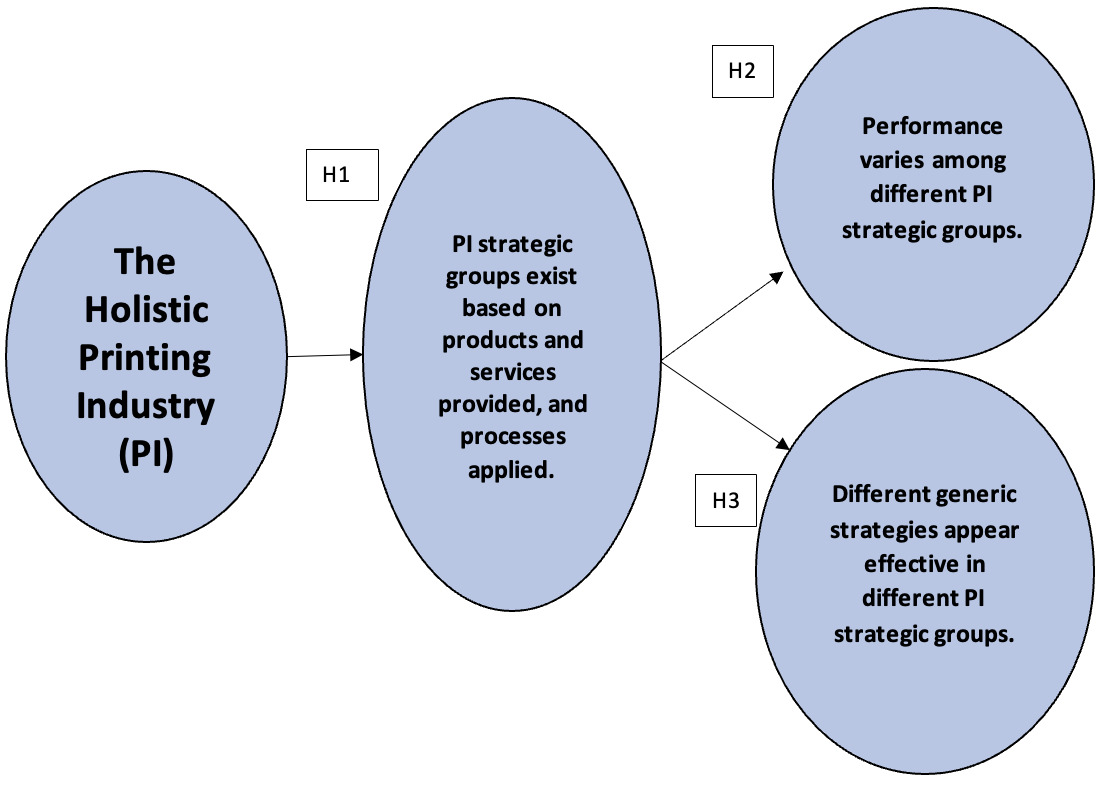
Hypothesis One: Printing industry strategic groups exist based on products provided, services provided, and processes applied.
From above, research in the travel industry indicates that firms in a strategic group benchmark each other’s performance to see legitimate comparative differences (Panagiotou, 2007). If benchmarking firms inside a company’s strategic group is practical, one would expect performance differences between different strategic groups. Given that various printing industry strategic groups have different target markets to which they provide different products and services, we expected to find performance differences among strategic groups. Therefore:
Hypothesis Two: Performance varies among different printing industry strategic groups.
From above, Panagiotou (2007) found strategic groups in the travel industry pursue different generic strategies. This aligns with the thought presented above that leaders of firms in the same strategic group see the same environmental view and apply cognitive processes resulting in common strategic approaches (Barney & Hoskisson, 1986; Dranove et al., 1998; Nath & Gruca, 1997; Spencer et al., 2003). However, we expand the previous cognitive process thoughts by applying generic strategy choice. Leaders of high-performing firms who see the environment accurately may choose the most effective generic strategy for their position in a strategic group. Therefore:
Hypothesis Three: Different generic strategies appear effective in different printing industry strategic groups.
Our hypotheses are illustrated in Figure Two below.
Methodology
Strategic Groups’ Relevance to the Printing Industry and Sample Collection
Over the last decade or so, the printing industry has changed significantly. Twenty years ago, most printing companies were “ink on paper” and applied similar printing processes (printing presses, folders, and bindery equipment) to produce products such as calendars, maps, brochures, books, labels, catalogs, magazines, and others. Twenty years ago, there was some diversification among printing companies. But in recent years, prompted by printed product substitutes (digital media) and printing production technology development (such as digital printing and others), printing firms have diversified greatly in what they provide customers and how they produce what they provide.
Our study was initially practitioner-driven. We worked with fifteen regional printing associations in the U.S., seeking to provide printing firm leaders with helpful strategic group knowledge relevant to their industry, such as performance benchmark numbers for different strategic groups. Together, the fifteen U.S. printing associations have about 3,500 members to whom emails were sent soliciting survey participation. One hundred and forty-five members completed our survey. As shown in our description below of the measure items applied, our survey was complex with multiple matrix questions. Indeed, multiple respondents opted not to answer the questions about the percentage of revenue generated from various products, services, and processes, which was a long list. After removing entries with incomplete or flawed answers, eighty-seven surveys were ultimately usable for the initial segregation of the organizations into clusters (Hypothesis One) and in the application of DEA exploring effective strategies (Hypothesis Three). Eighty-five observations were utilized in the comparison of performance (Hypothesis Two). Two of the eighty-seven surveys used for hypotheses one and three did not have complete performance entries for hypothesis two.
Certainly, eighty-seven (or eighty-five) completed surveys is not a large number. Indeed, Taherdoost, Sahibuddin, and Jalaliyoon (2014) suggest survey counts of at least 100, maybe 200, are needed. Would we have liked more completed surveys? – yes. However, the survey complexity described in the previous paragraph prompted multiple incomplete surveys.
Yet, the methods we applied are somewhat accommodating of small survey sizes. Dalmaijer et al. (2022) suggest expected sample sizes of 20 to 30 for each subgroup, which is accomplished by the existing sample size. Care was also used by the authors to not overly segregate based on the limited number of observations. More importantly, the resulting statistical separation of firms chosen by the authors was confirmed by industry insiders. DEA has a known bias towards higher efficiency scores as sample sizes decrease (Zhang & Bartels, 1998). As a result, the efficiency scores from this analysis provide an upper bound on the actual efficiency of the organizations. Thus, it is important to consider the differences in sample sizes when comparing the efficiencies between clusters.
The applied responses average revenue was $13,860,000 making this sample appropriate for small business research (the United States Small Business Administration generally views a firm as a small business if they have revenue of less than $28,000,000). Below, we describe the measures and methods applied to explore our three hypotheses.
Measures
Production Processes and Products/Services: To identify printing industry strategic groups, we sought what products and services each firm provided and what production processes they applied. The first question (Q20) asked respondents to identify the percentage of revenue that was derived from production processes that the responding firm applied. The second question (Q22) asked the percentage of revenue that was generated from products and services each responding firm provided its customers.
After evaluating the responses, prior to the statistical clustering of the firms into strategic groups (grouping firms based on products and production processes so that each firm is like the other firms in its cluster and different from firms in other clusters), we combined certain process questions and some product/service questions. The primary motivation in creating these aggregate variables was avoiding potential misallocation or individuals’ inability to specifically identify revenue percentages derived from the separate processes and products/services; many of these processes and products are nearly inseparable due to their similarity in creation and use. Separate clustering was performed with and without the aggregate variables to evaluate their effectiveness. Clearly and specifically identifiable and interpretable groups were visible when the aggregate variables were utilized.
Two aggregate questions were created involving processes. An aggregate question concerning the process of digital printing was created (Q20-Digitial Printing) as a summation of the percentage of revenue derived from “Digital printing without mailing (Q20-1),” “Combined offset and digital printing with mailing (Q20-3),” and “Digital printing with mailing (Q20-11).” An additional aggregate variable (Q20-Complementary) was created to capture the percentage of revenue created from “Non-printing complementary processes, consisting of related processes (marketing, creative design, data management, photography, etc.) (Q20-8),” “Other processes (Q20-9)” and “Fulfillment (Q20-12).” The ultimate form of the questions utilized in the analysis is listed below.
-
For each process listed below, provide an approximate % for which each process is reflected in your total revenue. (Base your answers on intuition. Make a “best guess.” Calculating the percentages from your records is not necessary.)
-
Q20-1 Digital printing data printing without mailing; Q20-3 Combined offset and digital with mailing; Q20-11 Digital printing with mailing – these three measures were aggregated to form Q20-Digitial Printing.
-
Q20-2 Wide-format printing
-
Q20-3 Sheetfed printing
-
Q20-4 Coldset web printing
-
Q20-5 Heatset web printing
-
Q20-6 Flexographic printing
-
Q20-7 Gravure printing
-
Q20-8 Related processes (marketing, creative design, data management, photography, etc.); 20-9 Other processes; Q20-12 Fulfillment – these three measures were aggregated to form Q20-Complementary.
-
To alleviate similar issues with questions concerning products and services, three aggregate variables were used as replacements for individual items. An aggregated measure (Q-22 Labels) was formed from “General packaging (litho labels, top sheets, folding carton, corrugated) (Q22-2)” and “Specialty packaging labels (adhesive labels, shrink labels, flexible packaging labels) (Q22-3).” An aggregated measure (Q-22 Wide format) as formed from “Point-of-purchase display signage (Q22-4),” and “Signs or banners (Q22-5).” A third aggregated measure (Q22-Complementary services) was formed from “Print-on-demand or web-to-print (online portals enabling customers to order relatively standardized printed products) (Q22-11),” Apparel (Q22-12)," “Related services (mailing, fulfillment, marketing, creative design, data management, photography, etc.) (Q22-13),” and “Other complementary services (Q22-14).” The final form of the questions, as used in the analysis, are shown below.
-
For the products and services listed below, provide an approximate % for which each is reflected in your total revenue. (Base your answers on intuition. Make a “best guess.” Calculating the percentages from your records is not necessary.)
-
Q22-1 General commercial printing (brochures, posters, business cards, stationery, business forms, greeting cards, envelopes, etc.)
-
Q22-2 General packaging (litho labels, top sheets, folding carton, corrugated); Q22-3 Specialized packaging (adhesive labels, shrink labels, flexible packaging) – these two measures were aggregated to form Q22-Labels.
-
Q22-4 Point-of-purchase displays; Q22-5 Signs or banners – these two measures were aggregated to form Q22-Wide format.
-
Q22-6 Books
-
Q22-7 Newspapers, publications
-
Q22-8 Direct mail
-
Q22-9 Catalogs
-
Q22-10Magazines
-
Q22-11 Print-on-demand or web-to-print; Q22-12 Apparel; Q22-13 Related services (mailing, fulfillment, marketing, creative design, data management, photography, etc.); Q22-14 Other complementary services – those four measures were aggregated to form Q-22 Complementary services.
-
Firm Performance: In exploring hypotheses two and three, we applied firm performance measures. We sought to determine if the clusters (strategic groups) formed based on printing and processes differ in organizational performance. We applied two types of firm performance measures: EBITDA (Earnings Before Interest, Taxes, Depreciation, and Amortization – an objective measure) and subjective small business performance measures. For EBITDA, we asked respondents to report their EBITDA as a percentage of revenue. Given businesses differ in debt use, tax requirements, and depreciation approaches, EBITDA is a good objective performance measurement tool.
However, several factors make small business objective financial measures questionable. For instance, small business accounting approaches vary, and small business accounting is not audited as in publicly traded firms. Also, owners may “tweak” accounting to reduce taxation, and low profits may result from owners drawing high compensation that one might consider as dividends. Therefore, measuring small business performance in research is a common challenge. To reduce the risk of invalid objective measures, we also applied subjective performance measures. Multiple other small business studies applied these subjective measures (i.e., Hernández-Linares et al., 2020; Huang, 2016; Kiviluoto et al., 2011; Manley et al., 2021; Williams et al., 2018; to name a few).
For our subjective firm performance measures, we applied Eddleston and Kellermann’s (2007) self-reported perceptual survey items. Self-reported perceptual performance measures are normally highly correlated with objective measures (Honig & Samuelsson, 2012; Shepherd & Wiklund, 2009). Respondents rated their firms’ performance relative to competitors on a 5-point Likert scale anchored by “much worse” and “much better.” The eight indicators assessed sales growth, profitability growth, growth in market share, growth in employment levels, return on equity, return on total assets, net profit margin, and their ability to fund growth from profit. Our subjective performance measures are listed below.
-
Subjective performance measures. Respondents answered on a 5-point Likert scale anchored by “much worse” and “much better.”
-
Q11-1 Relative to competitors in our region, my business’ growth in sales is…
-
Q11-2 Relative to competitors in our region, my business’ growth in profitability is…
-
Q11-3 Relative to competitors in our region, my business’ growth in market share is…
-
Q11-4 Relative to competitors in our region, my business’ growth in number of employees is…
-
Q11-5 Relative to competitors in our region, my business’ return on equity is…
-
Q11-6 Relative to competitors in our region, my business’ return on total assets is…
-
Q11-7 Relative to competitors in our region, my business’ net profit margin (return on sales) is…
-
Q11-8 Relative to competitors in our region, my business’ ability to fund growth from profit is…
-
Nevertheless, after discussing the eight subjective performance measures, our research team decided not to use two of the eight subjective measures. We saw “Q11-4, Relative to competitors in our region, my business’ growth in number of employees is…” as possibly not reflecting performance. A small business may enhance performance by growing without adding employees or by reducing employees. We saw “Q11-8, Relative to competitors in our region, my business’ ability to fund growth from profit is…” more related to what and how much assets a small business has. Therefore, we applied six of the eight subjective performance measures applied in our survey (Q11-4 and Q11-8 were not applied).
Generic Strategy Measures: To measure a firm’s strategic emphasis on differentiation or low-cost, we modified Karabag and Berggren’s (2014) indicators and applied them with a 5-point Likert scale anchored by “Do not focus on this” and “Strongly focus on this.” Our strategic emphasis items are listed below. Questions Q27-1, Q27-3, - Q275, Q27-7, - Q279, Q27-11, Q27-12, and Q27-14 relate to a low-cost strategic focus. Questions Q27-2, Q27-4, Q27-6, Q27-8, Q27-10, Q27-13, and Q27-15 relate to a differentiation strategic focus.
-
On the one-to-five scale, indicate how much your business focuses on each strategic tactic listed below.
-
Q27-1 Emphasis on purchasing raw materials or product components at the lowest cost (e.g., bargaining down prices)
-
Q27-2 Emphasis on new product development or adapting existing products to serve customers better
-
Q27-3 Emphasis on finding ways to reduce production costs
-
Q27-4 Fast new product introduction to market
-
Q27-5 Emphasis on operating efficiency (e.g., productivity in production)
-
Q27-6 Emphasis on offering more new products to the market
-
Q27-7 Emphasis on capacity utilization
-
Q27-8 Intense advertising and marketing
-
Q27-9 Emphasis on price competition (i.e., offering competitive prices)
-
Q27-10 Emphasis on developing and utilizing the sales team
-
Q27-11 Emphasis on tightly controlling selling/general/administration expenses
-
Q27-12 Monitor costs and assess them often
-
Q27-13 Emphasize superior product quality
-
Q24-14 We strive to reduce the costs of production or service.
-
Q27-15 Provide the best service
-
Analytical Techniques
Grouping: Cluster analysis, a statistical method for arranging observations into groups, is an unsupervised statistical technique. This means that there is no means to independently verify cluster membership. While silhouette scores (a metric to assess cluster fit) can be calculated, they tend to have issues when working with clusters of different sizes and/or non-spherical shapes (Arbelaitz et al., 2013). It was decided a priori that the meaningfulness of the clusters would be best determined by the extent a professional in this area would recognize differences between natural and forced organization groupings, which we discuss in the Results and Discussion section. The results from each clustering technique were assessed in terms of aggregate profiles of their membership based on a series of boxplots of the different values for the percentage of revenue derived from the different products, services, and processes, along with a logical assessment from industry experts.
Three techniques were utilized when clustering the organizations based on the original and aggregate variables concerning revenue generated from processes and products/services: 1) K-means clustering, whereby the data is separated into clusters by minimizing the squared distances between each observation and the centroid of the cluster; 2) Hierarchical clustering, whereby a tree-like structure of similar organizations is shown based on a chosen similarity measure (single, complete, average and Ward criteria measures were considered); and 3) Density-based Spatial Clustering, which attempts to group observations based on concentrated and sparse regions in the multivariate space. All techniques were applied utilizing the Python programming language with the Scikit-learn library (Pedregosa et al., 2011) and SciPy libraries (Virtanen et al., 2020).
Comparison of Means: To determine if significant overall differences existed in the mean values of the performance measures, we applied MANOVA. The advantage of MANOVA over separate ANOVAs is that, if the more stringent assumptions hold, MANOVA allows one to look for differences in multi-dimensional space when univariate differences may not appear. It also allows one to control statistical Type I error levels as a single test is performed with a given alpha level. For example, a difference could exist in a combination of mean sales growth and profitability growth between strategic groups where neither sales growth nor profitability growth shows a significant difference in means when analyzed individually. MANOVA would identify such a difference whereas separate ANOVAs would not.
MANOVA’s underlying assumptions are more demanding than ANOVA’s assumptions in that they require normality, homoscedasticity, and independence of errors in a multivariate sense rather than by individual variables. Multivariate assumptions are difficult to test, but one can test univariate versions to generally justify the multivariate version. Bartlett’s test of homoscedasticity and an omnibus test for normality (skew and kurtosis) showed some concerns, but that would be expected given the discrete levels of measurement in the Likert scale for the performance measures (Q11-1, Q11-2, Q11-3, Q11-5, Q11-6, and Q11-7). Quantile-quantile plots, which show how two sets of quantiles relate, indicated close approximation to normality for performance measures outside of a lack of continuity in the residuals. Given these results, we concluded that MANOVA results should be interpreted carefully and followed by post hoc with more robust tests to support findings.
Conversion of Inputs to Outputs: We sought to show relationships between unique combinations of inputs (generic strategies) and outputs for each organization as they strive for the best strategy fit and best performance. From this, we explored if different strategic positioning (inputs) is more effective in different strategic groups. An overreaching principle of this analysis is to not assume a generic strategic focus nor performance outcomes on any organization in a strategic group, but to allow each organization to define itself relative to other organizations in its cluster (strategic group).
To evaluate the relationship between strategic focus and performance, we applied Data Envelopment Analysis (DEA), a well-known procedure in operations management and research (Charnes et al., 1978). DEA is typically utilized to measure the technical efficiency in the ability of an organization to best convert its inputs into outputs. An organization is considered more efficient if it either uses the same input to generate more output or uses less input to generate the same output. Efficient firms can then be identified and used for benchmarking by other organizations in the same space/industry. The original version of DEA required constant returns to scale and was limited to measuring the technical efficiency of an organization, but a subsequent version of DEA (Banker et al., 1984) allowed for variable returns to scale and measured both technical and scale efficiencies.
DEA has been most commonly applied in manufacturing and operations analyses where the relationship between inputs and outputs is direct, but applications have extended the use of DEA to non-production applications. An extensive list of applications to energy and environmental studies was provided by Zhou, Ang, and Poh (2008) and to financial institutions by Berger and Humphrey (1997). Liu, Lu, Lu, and & Lin (2013) offer a comprehensive overview of DEA applications across different industries. Examples of the application of ordinal-scaled variables, like Likert scales, with DEA is shown in the evaluation of university departments (Cook et al., 2014), and the creation of a meta measure of sustainable development programs (Cherchye & Kuosmanen, 2006) among others.
A unique and powerful aspect of DEA is its ability to optimally define each organization’s combination of inputs and outputs to create its maximal efficiency score. In other words, DEA can determine that an organization is best presented (in efficiency) by weighting certain outputs and certain inputs before calculating the ratio of these weighted outputs to weighted inputs (i.e. the measure of efficiency). DEA mathematically selects weights to make an organization look the best way it can in terms of efficiency among its peers. So, rather than using subjectively chosen weights for each input and output, DEA determines the weights that provide an organization with the highest efficiency score relative to others in its market (or cluster/strategic group in this case). As DEA makes no assumptions about the underlying distributions of inputs and outputs, it is a nonparametric technique. Related, DEA may produce results that are inconsistent and lead to improved insight when compared with previous findings, such as Tamer and Ahmed’s (2020) look at the efficiency of corporate governance and intellectual capital and their effect on a firm’s financial distress.
Efficiency scores are limited to between one (perfect efficiency) and zero. In addition, DEA results provide each organization with peers that limit its efficiency from being greater. This key output is used for benchmarking manufacturing companies. In this case, each organization would know what other organizations are performing better in terms of outputs relative to the inputs that were chosen.
DEA requirements for its data include that values are non-negative, ratio-level, and continuous, but applications have shown that DEA can be effective and usable in situations where data is discrete, such as the case with Likert scales (Cook & Zhu, 2006). A major drawback of utilizing Likert and discrete-based data is that efficiency scores provided by DEA only provide a lower bound to the actual organization’s efficiency score (Chen et al., 2017). Thus, DEA utilization as a post hoc analysis of this data should focus on the benchmarking information provided and efficiency scores should be evaluated loosely. In conjunction with our discrete measurement via Likert scale, DEA assumes that less of an input and more of an output is better. Hence scales must be reversed if that assumption does not hold. Finally, DEA is highly sensitive to the number of dimensions (number of inputs and outputs) in which it is performed. Given DEA’s ability to find a maximal efficiency score within the scope provided, it may create ideal efficiency by weighting a unique combination of input(s) and output(s) in the data. Thus, it is possible that DEA would find every one of the organizations fully efficient in some niche space. For example, DEA could find an organization fully efficient because it was able to create the most growth in sales (Q11-1) from its emphasis on capacity utilization (Q27-7, a low-cost strategy emphasis measure).
We applied the variable returns to scale, or BCC model of DEA, as suggested by Cook and Kress (1999) when dealing with ordinal scales and the potential for variable returns. The BCC model provided a combination of efficiency made up of both technical and scale efficiency for each organization. An organization’s technical efficiency (from the CCR model) is defined as the ability of the organization to produce maximal output from the given input as compared to organizations at all scales (level of inputs and outputs). This allows the organization at the best level of inputs and outputs to set the standard for other organizations. Our data used in DEA purposely does not include values that are reflective of the size of the operation (e.g. revenue, number of employees). In this analysis, the scale can be thought of as the setting of the inputs (focus on low-cost or differentiation strategies) and resulting outputs (EBITDA and subjective performance measures). Our results from the BCC model are a mix of the technical ability of an organization to get the most performance at any level of focus on the generic strategies and the scalability to get the most performance among those organizations at similar generic strategy settings.
Given the requirements for variables’ form and structure, we made certain adjustments prior to performing DEA. The EBITDA values in our case include negative values (an EBITDA loss). To adjust EBITDA, we standardized the variable, so the maximum EBITDA percentage was assigned a value of 1 and the minimum a value of 0. To reduce the dimensional space and to rate organizations on their overall commitments to low-cost and differentiation strategies, the specific components of these strategic focuses were aggregated into two measures, one for commitment to a low-cost strategy and one for commitment to differentiation. As these measures were used for inputs (5-point Likert scale) and a higher score would be considered more focused on that strategy, these aggregate variables required scale reversal and re-scaling. While the aggregate values for the low-cost and differentiation measures could total up to 40 and 35 (Eight 5-point and seven 5-point Likert item scales, respectively), the resulting input variables were scaled from 0 to 10, with 0 being the most (reversed). Figure Five shows the joint distribution of the rescaled strategic focus measures. To alleviate the problems with many observations in a small space, the darkness of each point in the visualization relates to the number of observations.

In this novel strategic group application, the inputs (generic strategy) may not directly affect the outputs (EBITDA and perceived subjective comparative performance), but a generic strategy might align the organization strategically to perform better in its respective strategic group. Higher average efficiency scores in a certain cluster would indicate that firms in that group are finding ways to use their generic strategy to generate higher performance measures. In addition, the input and output values for technically efficient organizations in a cluster would signify which strategic focus levels are best for organizations in a cluster. For example, if the technically efficient organizations in a cluster all focus on low-cost strategies, then that would indicate that low-cost is the more effective strategic focus in that cluster.
Results and Discussion from an Industry View
Here, we describe the results from the methods described above as related to our three hypotheses. Often, we share perspectives from an “industry view.” We asked two regional association leaders to assess our findings and our view. These leaders connect with multiple printing companies; their view is much broader than through the lens of one company. In addition, these leaders have decades of printing industry experience and have seen the growing printing industry diversification. Without hesitation, the association leaders endorsed our findings and views as reflecting the printing industry.
Hypothesis One - Identifying Strategic Groups
After careful evaluation of the resulting clusters and their profiles, we chose Ward hierarchical clustering with three clusters as best representing the natural strategic groupings of printing businesses. The results, based on the five process and eight product revenue percentages, are shown in the dendrogram in Figure Three below. A dendrogram is a “tree” visualization often used in clustering to show the individual organizations (x-axis) and their similarities in terms of distance (y-axis). The point at which two observations or groups of observations are connected relates to a specific distance, a technique-dependent calculation with greater distance indicating greater difference. The horizontal cut line indicates our perception of where a natural break occurs in the tree branches. The dendrogram in Figure Three shows a natural cut (red line) separating the organizations into three distinct clusters of our 87 respondents. In the dendrogram, the three clusters (strategic groups) appear in three different colors: green (Cluster 2, n = 12), orange (Cluster 1, n = 59), and pink (Cluster 3, n = 16).

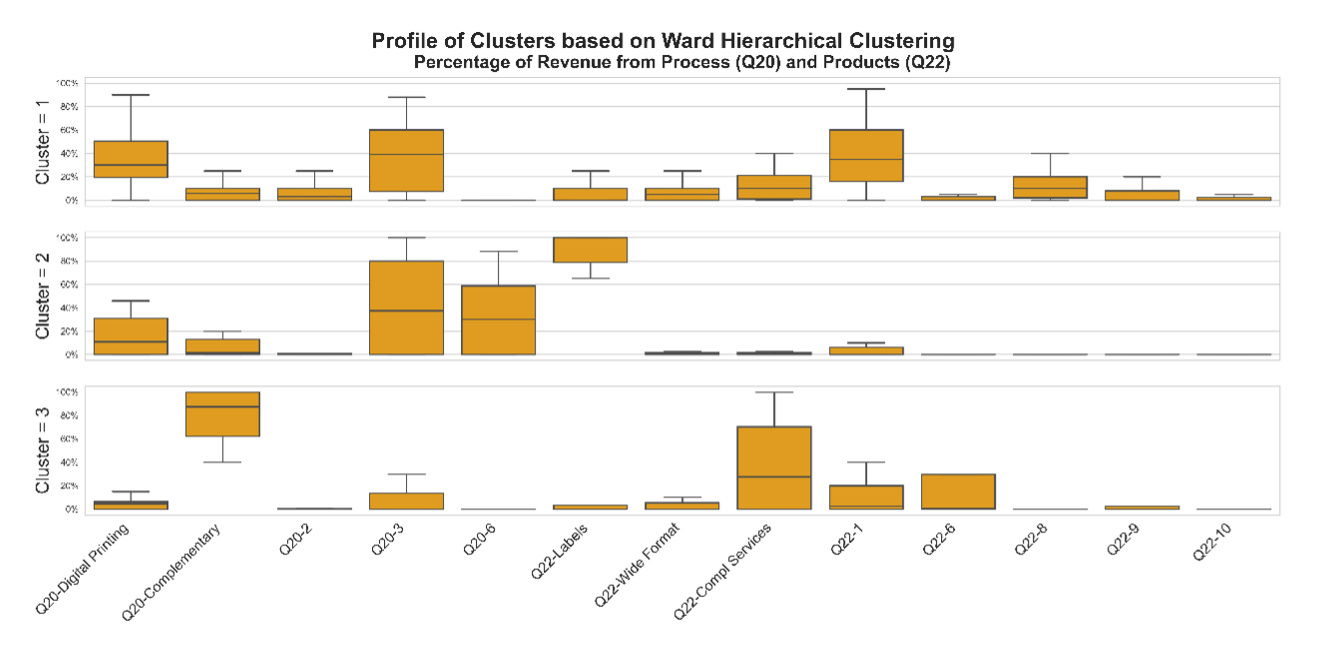
To assess if the strategic groups identified in the dendrogram were logical from a printing industry perspective, we assessed each cluster’s (strategic group’s) profile in a series of box plots of their underlying process and product revenue percentages. This profile was evaluated using the results from each clustering technique and was fundamental in determining the most natural clustering. The resulting box plot profile in Figure Four is for the final selected Ward hierarchical clusters.

Table One shows the number of observations and mean values for revenue and cluster variables by each cluster (strategic group).

Each of our three clusters (strategic groups) is described below:
Cluster 1: These firms provide general printing products (brochures, posters, business cards, stationery, business forms, greeting cards, envelopes, etc.). We also see that these firms produce direct mail, which are printed promotional items businesses mail to a mass of customers. These firms apply digital printing and sheet-fed printing processes, which fit the products these companies produce.
Cluster 2: – These firms focus on providing specialized packaging labels (adhesive labels, shrink labels, flexible packaging) and/or general packaging labels (litho labels, top sheets, folding cartons, corrugated cartons). Firms in Cluster 2 provide manufacturers with labels for their products. As a simple example, consider a can of vegetables on a grocery store shelf. That vegetable can will have a label, which was probably produced by a company that would fit in Cluster 2.
Cluster 3: – From a printed product and printing process perspective, Cluster 3 firms are similar to those reflected in Cluster 1. These firms provide general printing products (brochures, posters, business cards, stationery, business forms, greeting cards, direct mail, envelopes, etc.). These firms apply digital printing and sheetfed printing processes; these processes fit the products these companies produce.
However, Cluster 3 firms also have a strong presence in non-printing, complementary products and services, which might include fulfillment (storing goods for customers and shipping them on demand), promotional products (such as apparel), consulting, or marketing. As an example, we are aware of a firm that produces the products and applies the processes described just above and in the Cluster 1 description. But this firm also focuses on providing small businesses with marketing consulting, website development, and social media account management. These are non-printing products, but they complement the printing relationships the firm has with small businesses.
Assessment from an Industry View: The three clusters described above nicely fit what is seen in today’s printing industry. In other words, our cluster results reflect printing industry segments or strategic groups. First, firms in Cluster 2 reflect label printing, a segment of the printing industry focused on providing manufacturers with labels for their products, such as labels on cans or cardboard packaging. Firms in Cluster 1 and Cluster 3 both produce common printed products, such as direct mail pieces, brochures, calendars, books, and others. However, firms in Cluster 3 also focus on products or services that complement common printed products, which may help them grow revenue in the context of digital media, which lessens printed products’ demand. For example, a firm in Cluster 3 may provide a customer with direct mail pieces or brochures, but they may also provide marketing consulting, website design, or fulfillment (inventory management).
The groups suggested by our cluster analysis are reinforced by a view from printing industry experts. Therefore, our findings support Hypothesis One: Printing industry strategic groups exist based on products provided, services provided, and processes applied. Our findings are consistent with multiple recent research pieces demonstrating the existence of strategic groups (de Moraes et al., 2023; Feuillet et al., 2021; Peixoto et al., 2022; Penagos-Londoño et al., 2023).
Hypothesis Two - Strategic Group Performance
Our MANOVA results showed that taken in multivariate space, the mean values for EBITDA, Q11-1, Q11-2, Q11-3, Q11-5, Q11-6, and Q11-7 were not significantly different for the three clusters (p = .1008, see Table Two below). As the subjective performance measures cover different areas, we applied individual ANOVAs to evaluate differences in univariate space to see if any differences were significant on a univariate basis.
ANOVAs (see Table Three below) found differences in means among the strategic groups in two variables: EBITDA (p=.003) and Q11-1 (p=.031). Not surprisingly, a subsequent MANOVA analysis on just these variables found that mean differences were also significant in the multivariate space (p=.008) as EBITDA and Q11-1 differed together by cluster (strategic group).
Using Tukey HSD pairwise comparisons, we performed a post hoc analysis of differences in means among clusters (see Table Four below). Cluster 1 and Cluster 3 showed differences in mean EBITDA with Cluster 3 being significantly higher. Also, Cluster 1 and Cluster 2 differed in mean Q11-1 with Cluster 2 significantly higher. Other mean values shown in Table Four were not deemed significantly different statistically. The means in Table Four with statistically significant differences are highlighted.

Assessment from an Industry View: Given that Cluster 3 firms provide customers more value (through a combination of traditional printed products and complementary services) than Cluster 1 firms, who focus solely on traditional printed products, it is reasonable that Cluster 3 firms would generate more EBITDA than Cluster 1 firms. Cluster 2 firms, label printers, serve manufacturers who often focus on lowering costs. Customers of Cluster 2 firms may “shop” more for lower-cost label providers than would Cluster 3 customers seeking printing and complementary services. So, a higher EBITDA for Cluster 3 than Cluster 2 EBITDA is reasonable. As mentioned before, traditional printing is currently challenged by digital media. Therefore, it is reasonable that of the three clusters, Cluster 1, which focuses solely on traditional printing, has the lowest EBITDA.
Relative to Q11-1 (sales growth), given that label production is driven by GDP growth – as the economy grows, manufacturing needs more labels – it is reasonable for Cluster 2, label printing firms, to show the highest sales growth. In relation to digital media replacing traditional printing, it is reasonable that Cluster 3 firms (those with services complementing traditional printing) would have higher sales growth than Cluster 1 firms, who focus solely on traditional printing.
Our findings related to the three clusters’ performance reflect what is seen in the printing industry. Therefore, our findings support Hypothesis Two: Performance varies among different printing industry strategic groups. Recent research also supports performance variance among strategic groups (e.g., Cabral et al., 2020; de Moraes et al., 2023; Stanczyk-Hugiet et al., 2021).
Hypothesis Three - Effective Generic Strategy for Strategic Groups
DEA was performed using the DEAP software (Coelli, 1996). DEA efficiency scores for the different clusters (strategic groups) produced the statistics shown in Table Five below.
The higher average efficiency scores in Clusters 2 and 3 would indicate that firms in those groups are generating higher performance measures from their generic strategies. The strategic positioning of efficient firms in each cluster would shed light on which strategic focus levels are best for organizations in that cluster. In other words, by evaluating the individual efficient firms, it may be possible to identify more effective strategic focuses within a strategic group.
From a post hoc, logical assessment of the clusters, we saw two groups in Cluster 2 reflecting different types of label printing companies. Three of the six firms focus on general packaging labels (Group 2a below). The other three firms focus on specialized packaging labels (Group 2b below). We discuss this more in our “Assessment from an Industry View” section below. In Table Six below, we show the average low-cost and differentiation scores (based on a one-to-five scale) for the efficient firms for four clusters (strategic groups), with two groups of efficient firms for cluster 2 (2a and 2b.)
As shown in Table Six, the greatest variance in generic strategy emphasis among efficient firms was for low-cost strategy. All the efficient firms were similar on average in their emphasis on differentiation strategy. The similarity of scores for differentiation emphasis surprised us a little. However, given the printing industry’s technological advances, one can see how products are similar and difficult to differentiate. Therefore, our description below of these findings and our following assessment from an industry perspective focuses on low-cost strategy.
Cluster 1: All firms in Cluster 1 focused on low-cost. One firm focused on both low-cost and differentiation, nearly at the same level.
Cluster 2: Recall that firms in Cluster 2 focused on printing labels. Group A of Cluster 2 was low-cost focused, and they had the lowest EBITDA of the efficient organizations. Group B of Cluster 2 focuses less on low-cost strategy. It is interesting that two groups of efficient firms in Cluster 2 focus differently on low-cost strategy. Group 2a is relatively highly focused on low-cost strategy, and group 2b has a medium focus on low-cost strategy.
Cluster 3: Reall that from a product and process perspective, firms in Cluster 3 are similar to those reflected in Cluster 1, providing general printing products (brochures, posters, business cards, stationery, business forms, greeting cards, envelopes, etc.). However, Cluster 3 firms have a strong presence in non-printing complementing products and services, which might include fulfillment (storing goods for customers and shipping them on demand), promotional products (such as apparel), consulting, or marketing. Efficient firms in Cluster 3 had the least average low-cost focus than the other clusters. In Cluster 3, one efficient organization was focused heavily on differentiation.
Assessment from an industry view: Recall that Cluster 1 firms provide general printing products (brochures, posters, business cards, stationery, business forms, greeting cards, envelopes, etc.), without complementary services. Firms in Cluster 1 face a lot of competitors, and their customers are transitioning from printed products to communicating online, through social media, websites, emails, and other digital media outlets. Given this competitive environment, it is reasonable to see firms in Cluster 1 as focused on low-cost. Indeed, they are tied for the highest low-cost emphasis among the clusters. Also, as they battle digital media outlets and only provide printed products (not complementary services), their printed products must stand out as high quality and special. Therefore, they focus on differentiation, with the highest differentiation emphasis among efficient firms in other clusters. Generally, this strategic group is seen in the printing industry as challenged by the external environment. The need to emphasize both low-cost and differentiation might form a strategic challenge.
Finding two groups in Cluster 2 (label printing companies) makes sense from an industry view as some label printing companies focus on providing large retail manufacturers product labels, such as vegetable can labels (Group 2a). Group 2a of Cluster 2 was low-cost focused, and they had the lowest EBITDA of the efficient organizations. Group 2a focused on sales growth. This aligns with what we see in the printing industry. Group 2a of Cluster 2 probably targets large manufacturers of retail products, and those customers will consistently seek to lower their costs, especially what they procure, such as labels. Firms in Group 2a will seek to grow sales, as more revenue produced from the same fixed costs creates economies of scale, which will help lower their product prices for price-conscious retail manufacturers.
Other label printing companies (Group 2b) may focus on providing more specialized and unique labels to smaller specialized companies. A label printing company providing wine-bottle labels to small companies producing bottled wine may fall into Group 2b as that company would seek to provide unique labels (ones with special colors, foils, and embossing) to a vineyard. That wine company may need a unique bottle label to draw attention to their wine and are less focused on costs than Group 2a customers. Therefore, Group 2b has the second lowest emphasis on low-cost, much lower than Group 2a, which provides large manufacturers with product labels. We were a bit surprised not to see a higher emphasis on differentiation among efficient Group 2b firms. One of the firms in Group 2b focused on sales growth while another was focused on EBITDA, which is probably driven by the company’s long-term vision. Are they seeking to gain a stronger presence in the unique label market, or are they pleased with their position in the market and want to focus more on drawing profit?
Again, firms in Cluster 3 provide the same traditional printed products as firms in Cluster 1. However, in addition to traditional printed products, Cluster 3 firms also provide complementary services, such as marketing consulting, website design, inventory management, and others. That firm’s leaders may say to small businesses, “Purchase from us your traditional printing, marketing consulting services, and website design, and we will coordinate those activities – making them more effective together.” Therefore, those firms are not as focused on low-cost strategy as the other clusters. Indeed, Cluster 3 has the lowest low-cost strategy emphasis among all the clusters, and Cluster 3’s low-cost emphasis is far lower than Cluster 1’s (firms providing the same printed products as Cluster 3, but not complementary services).
Our findings related to effective strategies in the three clusters (four groups) reflect what is seen in the printing industry, providing support for Hypothesis Three: Different generic strategies appear effective in different strategic groups. Recent research supports the possibility that different strategies are effective in different strategic groups (e.g., de Moraes et al., 2023; Penagos-Londoño et al., 2023; Sarkar, 2023).
Conclusion
Summary
Our findings support all three of our hypotheses: Hypothesis One: Printing industry strategic groups exist based on products and services provided, and processes applied; Hypothesis Two: Performance varies among different printing industry strategic groups; Hypothesis Three: Different generic strategies appear effective in different strategic groups. Furthermore, empirical evidence from an industry view supports the nomological validity of our findings.
Limitations & Future Research
Admittedly, our study applied a narrow lens, limited to a single industry, the printing industry. One might see our compressed view as a limitation. However, as strategic groups form in an industry, a single-industry approach is applicable to this topic. Given the printing industry product and service diversity, we see that industry as appropriate for exploring variance between small business strategic groups and the effectiveness of different generic strategies in different strategic groups. However, future research might replicate the present research by exploring our hypotheses in other industries. However, as strategic groups are different in different industries, we do not see combining data from multiple industries as a strategic group research option. Researchers might explore our hypotheses in different industries, but separately.
Our small sample size is a limitation. A simpler survey may have generated more completed surveys. However, given we were gaging a plethora of products, services, and processes, a simple survey was not functional. Hopefully, the solid endorsement of our findings by association leaders in the printing industry contributes nomological validity to our findings.
Future research could also employ qualitative methodology to dig deeper into how small business leaders cognitively consider their internal and external environment. Do small business leaders recognize their “membership” in a strategic group? Do they benchmark their firm’s performance to high-performing firms in their strategic group? Do they recognize the efficient relationship between a specific generic strategy and firm performance in their strategic group? And do the most efficient firms (those with a solid connection between generic strategy and firm performance) understand how they achieved their efficiency? Another issue to address qualitatively is whether the efficient firms (or inefficient firms, for that matter) perceive their own efficiency (or inefficiency).
Finally, future longitudinal research could examine the following interesting questions. How do firms maintain their efficient status of applying the most effective generic strategy for their strategic group and maintaining strong firm performance? How do inefficient firms make progress “on the path” to efficiency – recognizing and converting to the effective generic strategy for their strategic group? Do either or both sets of firms demonstrate an understanding of their status as being efficient (inefficient), applying the appropriate generic strategy for their strategic group?
Practical Implications
Our study highlights the importance of identifying your strategic group as well as the strategic group leaders. This will enable a manager to benchmark their own inputs and outputs relative to those strategic group leaders and derive prescriptive actions to improve their competitive positioning. Additionally, our results highlight the importance of cognitive, proactive thinking rather than reactive thinking. Good performance or firm efficiency are functions of a combination of a set of inputs, not happenstance. Managers must understand what makes firms in their strategic groups successful and do what they can to mimic the appropriate input mix. Finally, when considering a change in strategy or input allocation, a manager needs to analyze the performance or efficiency levels of the “new group” to which they aspire. Is the grass really greener in the new competitive space? Are we better equipped to compete there?
Closing Remarks
Scholars have debated the relevance of strategic groups, and some have even questioned their existence. Based on our exploratory research, we contribute to the strategic group literature by confirming their existence in the printing industry. The strategic groups we found have nomological validity among industry experts. They “make sense” for the industry. The performance of the various groups differs in meaningful ways which also supports previous strategic group research. Our use of Data Envelopment Analysis, which allows for multiple combinations of inputs and outputs to achieve efficiency, is a novel application for strategic group research. The findings suggest there is an optimal generic strategy for each of the strategic groups that we identified for the printing industry.