
Introduction
Small businesses face the challenge of adapting to consumer payment preferences that increasingly favor cashless transactions (Nawrocki, 2024). This shift toward digital wallets represents a need for additional research, as adopting e-payment systems has become a critical question for expanding entrepreneurial opportunities (Sharma et al., 2024; Sutticherchart & Rakthin, 2023). Customers spend more using cashless methods, with this effect size being particularly important for small businesses and entrepreneurs (Agarwal et al., 2019; Broekhoff & van der Cruijsen, 2024; Schomburgk et al., 2024). At the same time, the fees associated with cashless transactions create a need to understand the opportunity costs for restricting payment options to cash-only (Aurazo & Vega, 2021; Shy, 2022). These fees go so far as to make some academics argue that payment card fees are “biased” against retail firms (Wright, 2012).
Despite research needs in financial technology adoption, few studies have considered how e-payment systems might increase economic opportunity for small and medium-sized enterprises (Fauzi & Sheng, 2022). These opportunities are worth exploring as large retailers push toward “phygital,” smart retailing environments by physically and digitally engaging with consumers (Johnson & Barlow, 2021; Tan et al., 2024). In response, this article explores how adding digital payment technologies might position local food producers in a way that capitalizes on increased sales opportunities by reducing transaction costs. Integrating electronic payments into the market framework of U.S. farmers’ markets reflects a larger trend in consumer behavior, as retail consumers increasingly prefer cashless transactions for convenience and security reasons (Brown et al., 2022; See-To & Ngai, 2019).
Focusing on e-payments at the point-of-sale (POS) in the U.S. local foods sector allows us to provide insights that extend into the broader scope of small business marketing strategy. This exploration is relevant for business leaders and policymakers, as payment technology can drive additional firm-level growth. Because of heightened consumer acceptance of retail payment technology, digital payments can align small business operations with consumer expectations, enhancing customer satisfaction and loyalty (Thomas-Francois & Somogyi, 2023). Cashless payment systems have also been shown to reduce tax evasion, making adoption particularly relevant for policy (Bohne et al., 2023).
We discuss patterns that might inform broader entrepreneurial practices by examining how such systems are utilized within U.S. farmers’ markets—a classic archetype of small, direct-to-consumer businesses. While the prior literature focuses on technology adoption to increase productivity, our study underscores a significant business trend toward the strategic adoption of technology to enhance consumer engagement and operational efficiency (Torres, 2022). We draw insights from the Technology Acceptance Model (TAM) and the Service Innovation (SI) framework to explore how payment systems might promote growth in direct-to-consumer farms and local food systems.
To identify the size of this potential growth, we use secondary data from the U.S. Department of Agriculture Food Environment Atlas to compare and contrast counties with and without farmers’ markets using e-payment systems. We then used primary data from a survey of U.S. consumers to examine the characteristics and payment preferences of people who do and do not regularly shop at farmers’ markets. Based on that primary data, we develop local food market customer segments based on payment preferences, which allows us to empirically demonstrate the potential for market expansion via investment in digital payment technology. This is unique because many prior studies focus on the firm-level decision-making process associated with technology adoption, such as increased access to automated credit lines (Blichfeldt & Faullant, 2021; Hau et al., 2024; Oduro et al., 2023). Fewer studies explore how the mismatch between consumer expectations (regarding payment options) and the available technology affects small business profitability and customer satisfaction. By drawing more attention to consumer behavior, we seek to bridge technology adoption models with consumer-driven entrepreneurship research.
Background
The United States is home to more than 147,000 farms engaging in direct sales, many of which rely on the nation’s 8,000 farmers’ markets to sell their products (U.S. Department of Agriculture, n.d.). Local food markets typically involve unique supply chains where farmers perform most marketing functions, including packaging, transportation, distribution, and advertising. Farmers’ markets are an essential sales channel for agricultural producers to reach their consumers, especially for small and midsized specialty-crop farmers, who consider direct-to-consumer marketing their most feasible outlet and a way to capture higher returns (Detre et al., 2010). Politicians and philanthropists have expressed continued interest in supporting local food initiatives through extensive programming and billions of dollars in funding direct-to-consumer channels, such as farmers’ markets, farm stores, and community-supported agriculture (CSAs), accounted for 85% of low-income (<$75,000 gross cash farm income) farm sales in 2020 (Plakias et al., 2020; Whitt et al., 2021).
Despite increased policies supporting regional food networks, the market share of direct-to-consumer farms remains small. In 2020, 32.2% of the $9.0 billion in direct farm sales were by direct-to-consumer producers despite representing 77% of all farms with direct sales (U.S. Department of Agriculture, n.d.). Furthermore, there are signs that direct-to-consumer sales, including farmers’ markets and Community Support Agriculture (CSAs), are plateauing as U.S. local food markets mature (Thilmany & Woods, 2018). Between 2007 and 2012, the number of farmers engaged in direct sales to consumers increased, but the average sales per direct-to-consumer farm decreased during the same period (Low et al., 2015).
Concurrent with these challenges to “mainstreaming” local foods, U.S. consumers have become increasingly interested in cashless purchasing habits, forcing small businesses to change their shopping experiences. In 2019, 75% of households had at least one general-use credit card. Furthermore, nearly 30% of Americans make zero weekly purchases in cash (Perrin, 2018). At the same time, just 51% of all U.S. counties are home to at least one farmer’s market that accepts credit cards (U.S. Department of Agriculture, 2022). Adopting digital payment systems has increased transaction convenience and credit access in other entrepreneurial sectors. However, success relies on strong financial and tech infrastructure and financial literacy to use financial products efficiently (Klapper, 2017). This mismatch between consumer and producer payment preferences points to another potential technology that may increase small farm profitability.
Instead of focusing on firm-level consequences from payment systems, the existing literature on electronic payments at farmers’ markets primarily focuses on the disparity between the availability of electronic benefit transfer (EBT) payment systems and the local population participating in food benefit programs (Wasserman et al., 2010, U.S. Department of Agriculture, Food and Nutrition Service 2013). These studies highlight the opportunity for farmers’ market vendors to increase their share of SNAP dollars and reach a broader customer base via EBT technology. Frequently cited barriers to adopting EBT systems include lack of internet access, the increased burden of processing payments, limited knowledge about the application and payment system, and small EBT clientele (Kellegrew et al., 2018). For credit and debit cards, a series of choice experiments conducted at Washington farmers’ markets indicated that vendors were willing to pay between 0.49% and 0.72% fees per $20 transaction for excellent electronic payment technology. However, there was no evidence of consumer willingness to pay for such transaction options (Gallardo et al., 2015). These vendors indicated they valued the payment provider’s machine quality, ease of use, and provider’s customer service. The same study indicated that e-payment technology remains in an earlier adoption stage. However, individuals managing larger markets with more experience were more likely to adopt such technology and less concerned with technology costs.
Conceptual Framework
The process by which innovations are adopted has been a critical area of research for decades. Technology adoption has been especially important for small businesses, where the perceived value of the technology is weighed against social expectations of the technology use and the firm’s openness to innovation in general (Solberg et al., 2020). Our conceptual framework is focused on the role of transaction costs in technology adoption and consumer payment behavior at the point of sale (POS), reframing the adoption of electronic payment (e-payment) systems as a service innovation (Figure 1). This approach highlights how e-payment systems can create a customer experience that expands the farmer’s customer base while simultaneously serving as the foundation for offering value-added services such as mobile pre-orders, personalized discounts, and loyalty programs. Through this lens, adopting e-payment technologies represents a broader business model innovation that allows small businesses to adapt to evolving consumer preferences and thrive in a competitive market (Bouwman et al., 2019).

Technology Acceptance Model
The TAM emphasizes that users (vendors and consumers) will adopt a technology if they perceive it as useful and easy to use (Lew et al., 2020; Reynolds et al., 2020). In the context of farmers’ markets, if vendors and consumers believe that adopting credit card systems simplifies transactions and enhances convenience, they are more likely to embrace the technology. This ties into service innovation, where credit card systems are an added service process allowing enhanced services like loyalty programs, personalized discounts, and pre-order systems (Wang et al., 2015). The perceived usefulness of these added services further drives adoption.
We integrate transaction cost economics (TCE) into the TAM by considering how TCE affects the perceived usefulness and perceived ease of use of technology, such as e-payment systems at farmers’ markets. Transaction costs refer to the expenses incurred in a transaction, such as the effort required for information gathering, contracting, monitoring, and enforcing agreements. TCE has a strong relationship with agri-food technology adoption, particularly as they relate to more novel production supply chains (Loy et al., 2024). Because of the value of TCE in the small business supply chain management literature, we anticipate several transaction costs associated with buying in local food markets (Arend & Wisner, 2005). If adopting a new technology reduces these costs, it increases the perceived usefulness of the technology. For instance, consumers and vendors may see credit card payment systems as useful if they reduce the time and cognitive effort required to complete transactions. The ability to avoid carrying cash and the convenience of quicker checkouts can also lower the overall transaction costs, thus making the technology more attractive. As such, vendors may see reducing cash-handling costs (e.g., transporting cash, dealing with change, security concerns) as increasing the usefulness of digital payment systems.
Transaction costs can also affect the ease of use of a technology. If the costs (in terms of time, effort, or learning) associated with adopting and using the technology are perceived to be low, users are more likely to adopt it. For example, suppose vendors perceive that integrating credit card systems into their sales process is easy (with low setup costs, straightforward processes, and minimal effort to maintain). In that case, they are more likely to use these systems. Consumers may also find e-payment systems more appealing if they are easy to use, reducing the mental effort associated with calculating prices and managing cash, thus lowering cognitive transaction costs.
In some cases, reducing transactions costs can facilitate both usefulness and ease of use. For example, reducing opportunity costs (the time spent waiting in line or the chance of losing sales due to cash-only restrictions) and information costs (learning about when, where, and how to pay) can make payments smoother and faster while lowering these costs, increasing consumer and vendor interest in adoption.
Service Innovation
Service innovation occurs when firms strategically reconsider payment systems as tools that enable differentiated services, which might aid farmers’ markets as they compete with more traditional retail outlets (Lightfoot & Gebauer, 2011). E-payment systems serve as a platform for service innovation, enabling vendors to offer mobile pre-orders, personalized discounts, and loyalty programs. These services can further streamline the shopping experience and incentivize repeat visits. For example, a customer could place an order via a mobile app and pick it up at the market, avoiding long lines and ensuring product availability. E-payments also create additional opportunities to leverage customer loyalty into financial gains (Zhang et al., 2023). These innovations transform the farmers’ market experience, aligning it more closely with consumer expectations for convenience and personalization.
Positioning e-payment systems as a service innovation reframes their role within farmers’ markets, highlighting their potential to differentiate these markets from traditional retail environments. Relative to a traditional grocery retail shopping experience, this service innovation is particularly important for farmers’ markets as consumers typically evaluate their local food purchases through a more pro-social lens (Farris et al., 2019; Moreno & Malone, 2021). E-payment systems enable vendors to offer additional value-added services that enhance customer engagement, build loyalty, and drive sales. These innovations represent a shift from traditional payment methods to a more customer-centric business model, where technology is used to reduce friction and create new opportunities for market growth.
Heterogeneity in Technology Adoption
Adoption typically follows an S-curve, with different groups adopting the technology at different rates (Inwood et al., 2009). Each group is progressively more resistant to change and further from the original innovator, which can create significant challenges in reaching a critical mass of users. Recent research has further applied this idea by identifying adopters and non-adopters of mobile payment systems (Dash et al., 2023; Shaw et al., 2022). As with any technological innovation, there are generational and behavioral differences in adopting e-payment systems (González-Anleo et al., 2024). Older consumers prefer paying with cash, as they perceive it to be more transparent and tangible, providing a clearer sense of how much they are spending (Parks-Stamm & Flinner, 2024). In contrast, younger consumers, particularly Millennials and Gen Z, are more comfortable with digital payment methods and are likelier to use mobile payment apps.
These generational differences highlight the importance of tailoring payment systems to meet the needs of different consumer segments (Boden et al., 2020). For example, while offering cashless payment options to attract tech-savvy consumers is valuable, it is equally important to maintain cash payment options for older consumers who may be more resistant to change. By offering a hybrid payment system that accommodates both preferences, farmers’ markets can ensure that they remain accessible to a broad range of customers while also capitalizing on the growing trend toward cashless transactions.
There may also be differences in political preference, as previous research suggests that political ideology can influence consumer behavior, particularly concerning local food systems and sustainability (Biedny et al., 2020; Malone & Norwood, 2020). For example, liberal-leaning consumers may be more supportive of localism and environmental sustainability, which could influence their willingness to spend more at farmers’ markets and adopt digital payment technologies.
Methods
An important emphasis for both TAM and service innovations is the value of enhancing user experience. TAM provides insight into why users adopt new technologies based on their perceptions, while service innovation explains how these technologies transform the market experience. Combined, they offer a unique view, reframing e-payments at farmers’ markets as a strategic move that improves customer engagement and operational efficiency. Through primary and secondary data sources, we identify the potential for market growth by considering payment methods as a transaction cost in farmers’ markets. We use secondary data from the 2020 Food Environment Atlas and the 2017 U.S. Department of Agriculture Census of Agriculture, which defines farmers’ markets as two or more vendors selling agricultural products directly to consumers at a recurring location.[1] The Atlas includes information about the availability of payment systems such as credit cards and electronic benefit transactions at farmers’ markets and various indicators of direct-to-consumer outcomes.[2] We focus on two objectives: 1) assessing U.S. payment system trends and identifying relationships between available payment systems and population/farm demographics, and 2) identifying qualities and spending habits of consumers who express willingness to pay for credit cards and other electronic payment options in local food markets.
We then collect primary data to analyze consumer purchasing habits and consumer insights on transaction costs related to financial technology at farmers’ markets. We electronically administered 1,039 U.S. consumer surveys via SSI Dynata to collect information regarding participation in local food markets, available payment systems at markets, friction in using available systems, consumer tech literacy, and potential for increased purchases given additional switches to cashless payment systems. The primary goal of this approach is to identify if consumers are more likely to spend more at farmers’ markets if credit cards, EBT, or other cashless payment forms are available. We asked respondents about their current transaction methods at farmers’ markets and whether they had ever been unable to complete a transaction at a farmers’ market. Next, they were asked about their familiarity with cashless payment apps such as Venmo or Cash App and the frequency of their use. Additionally, respondents were asked to indicate their likelihood of purchasing more goods from farmers’ market vendors if they accepted credit cards or SNAP/EBT payments. The survey also included questions related to demographic information such as religion, age, income, money spent on food, race, and political affiliation.
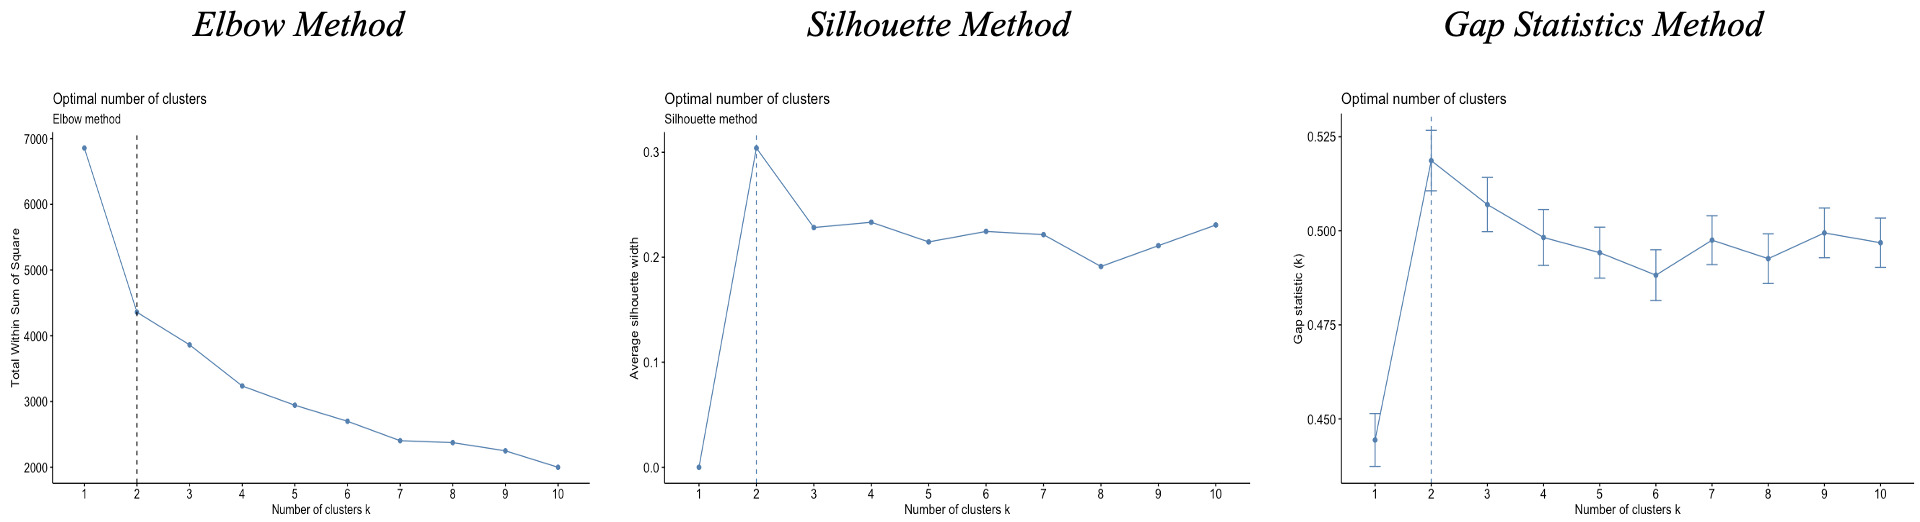
In addition to a simple comparison of means, we used k-means cluster analysis to explore the opinions of different underlying categories of U.S. local food consumers. K-means clustering analysis is an unsupervised machine-learning technique for grouping similar data points into distinct clusters (Malone & Lusk, 2018). It partitions a given dataset into a predefined k number of clusters. Each cluster represents a distinct group characterized by similar features or patterns. For our analysis, we determined the optimal number of clusters by analyzing payment preferences expressed by survey participants. We consult the elbow, silhouette, and gap statistics methods to determine the optimal number of k groups. We clustered on the following questions:
-
Have you ever been unable to complete a transaction at a farmers’ market? (Yes/No)
-
How often do you go to farmers’ markets? (Scale: 1 = Never, 5 = Weekly)
-
Would you be more likely to purchase goods from a farmers’ market vendor if they accept credit cards? (Scale: 1 = Definitely not, 5 = Definitely yes)
-
Would you be more likely to purchase goods from a farmers’ market vendor if they accept SNAP/EBT payments? (Scale: 1 = Definitely not, 5 = Definitely yes)
-
Would you use cashless payment apps at a farmers’ market? (Scale: 1 = Definitely not, 5 = Definitely yes)
Results
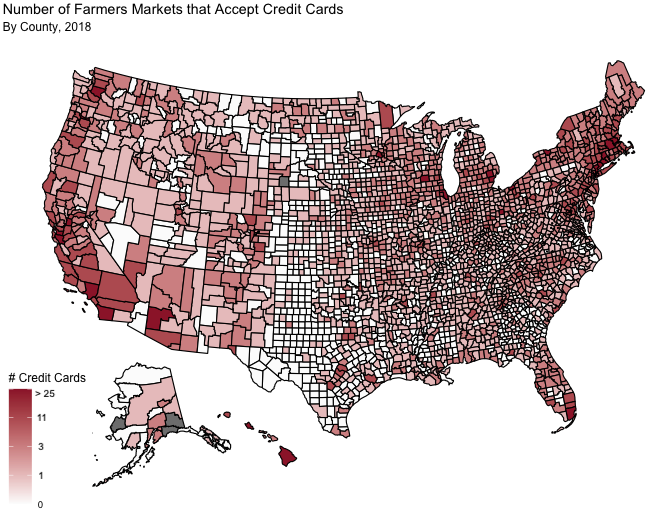
We first explore the secondary data, which indicates that 58.2% of the 8661 farmers’ markets in the United States accepted credit cards in 2018, while 72.2% of all U.S. counties had at least one farmers’ market in 2018. Of all counties with at least one farmers’ market, 70.3% had at least one farmer’s market that accepted cards. Figure 2 presents a map of U.S. counties by the percentage of farmers’ markets that accept credit cards. This map reflects regional differences in the availability of farmers’ markets and the share of local food activity. The map shows that the U.S.‘s northeast and southwest regions have more farmers’ markets that accept credit cards. In 2020, these regions also had the most direct-to-consumer farms and contributed most to American direct farm sales (U.S. Department of Agriculture, n.d.). The southwest region had 25,644 farms engaged in direct sales, accounting for 23% of all direct farm sales in 2020. The northeast had 26,707 farms engaged in direct sales, accounting for 28% of direct farm sales.

Table 1 further investigates the differences between counties with and without credit card acceptance at farmers’ markets. Table 1 presents demographic information about counties that have and do not have farmers’ markets with credit cards. This table does not include counties with zero farmers’ markets in 2018. We find significant differences in the median income, proportion of the population older than 65, metro vs. nonmetro classification, and poverty rate of these counties. 52.0% of the counties with farmers’ markets accepting credit cards were classified as “metro” counties, while just 22.4% of counties with no farmers’ markets accepting credit cards were classified as such. Counties are labeled “metro” if they contain at least one urbanized area: the county has a high-density area with over 50,000 people or is economically tied to a central county as measured by the share of daily commuting workers. Median income in counties with farmers’ markets accepting credit cards is higher ($51,591) than in counties without markets that accept credit cards ($46,219). Furthermore, poverty rates in counties with farmers’ markets that accept credit cards are slightly lower (15.1%) than counties’ without credit card payments at markets (16.9%). Counties that don’t accept credit cards at any farmers’ markets also have slightly more people over the age of 65 (16.6%) than counties that have markets accepting credit cards (15.1%).
Counties without credit card access at farmers’ markets tend to be nonmetro, have lower median income, and have more people over age 65. However, it remains unclear whether producers could expect higher expenditures at farmers’ markets if additional payment systems were available. To explore this question, we surveyed 1,039 U.S. consumers to explore their purchasing behavior at farmers’ markets. Results indicate that 33.9% reported going to farmers’ markets at least monthly. Table 2 presents the characteristics of people who commonly attend farmers’ markets at least monthly. We find statistically significant differences in income, political affiliation, age, average weekly food spending, and “foodie” self-identification. Respondents who reported attending farmers’ markets regularly spend more on average per week ($127.45 per week) than those who do not regularly attend ($106.03 per week). This difference in weekly food spending is likely unrelated to differences in income, as we fail to find a significant difference in the average reported incomes of both groups. Respondents were also asked whether or not they self-identified as a “foodie,” which has been found to represent a unique market segment of consumers who spend a larger share of their income on both food at home and food away from home (Chang et al., 2020; Malone et al., 2024; Pickering & Pickering, 2022). Those who regularly attend farmers’ markets, on average, responded “neither yes nor no,” while those who do not attend farmers’ markets regularly, on average, answered “probably not.” The respondents who regularly attend farmers’ markets have a slightly lower average age (46.6 years) than respondents who do not attend regularly (50.8 years). While the two groups did not meaningfully differ in left vs. right political leanings, more of the sample that reported regularly visiting farmers’ markets identified with either the Democrat or Republican Party (74.2%) than those who do not regularly attend (65.3%).
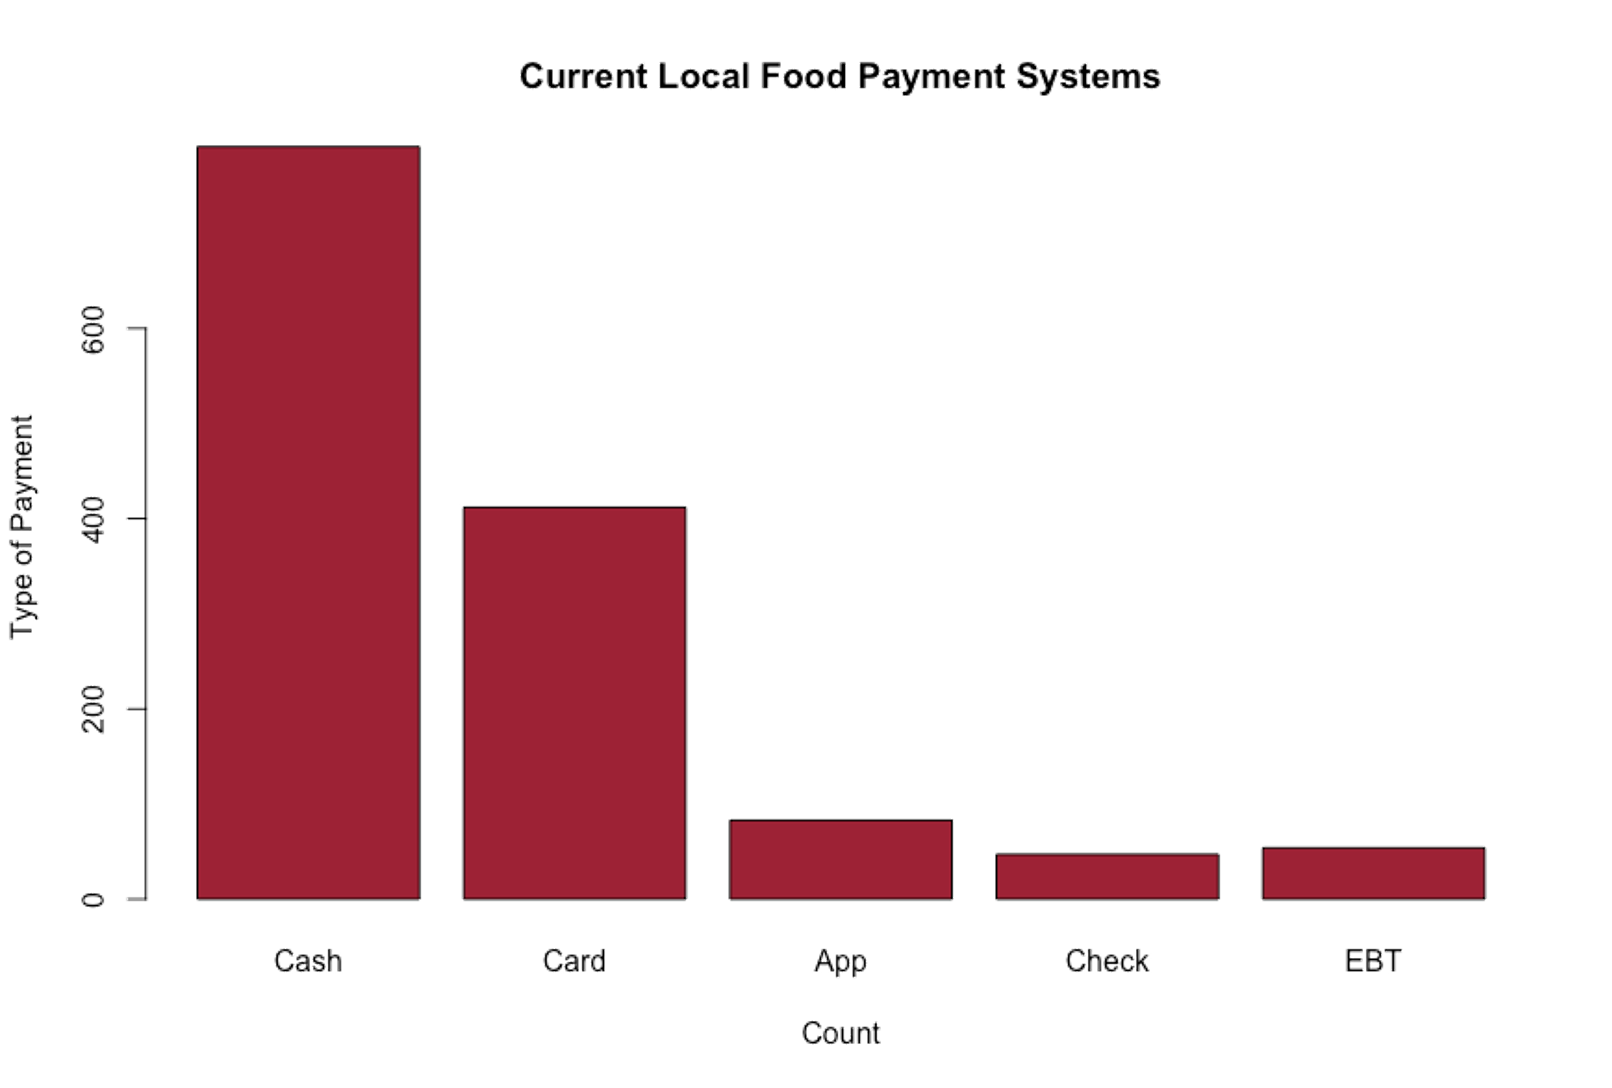
Figure 3 presents the different payments used by farmers’ market patrons in our sample. Of all the survey respondents, 76% reported typically using cash as their mode of payment when shopping at farmers’ markets. Only 39.7% of respondents indicated they regularly use cards to pay for goods at farmers’ markets. Less than 8% of the respondents used any other purchasing methods. Figure 2 further supports that despite significant changes in the overall purchasing habits of American consumers, cash is still the primary form of payment accepted and used in local farmers’ markets.

We also asked survey respondents about their experiences completing transactions at farmers’ markets. Table 3 presents the results, with responses separated by households who do and do not regularly shop at farmers’ markets (at least monthly). About a quarter of all participants (28%) have had an experience where they could not complete a transaction due to incompatible payment options. Furthermore, over half (54%) of the respondents reported being more likely to purchase goods at markets if credit cards were accepted. Between consumers who regularly attend farmers’ markets and those who do not, we find statistically significant differences in their willingness to spend additional money given more payment options and their willingness to adopt cashless payment apps. Regular market consumers are more willing to spend given additional payment options, such as credit cards and SNAP/EBT payments. Additionally, regular customers are more likely to have cashless payment apps such as Cash App, Venmo, and Zelle.
Market Segmentation
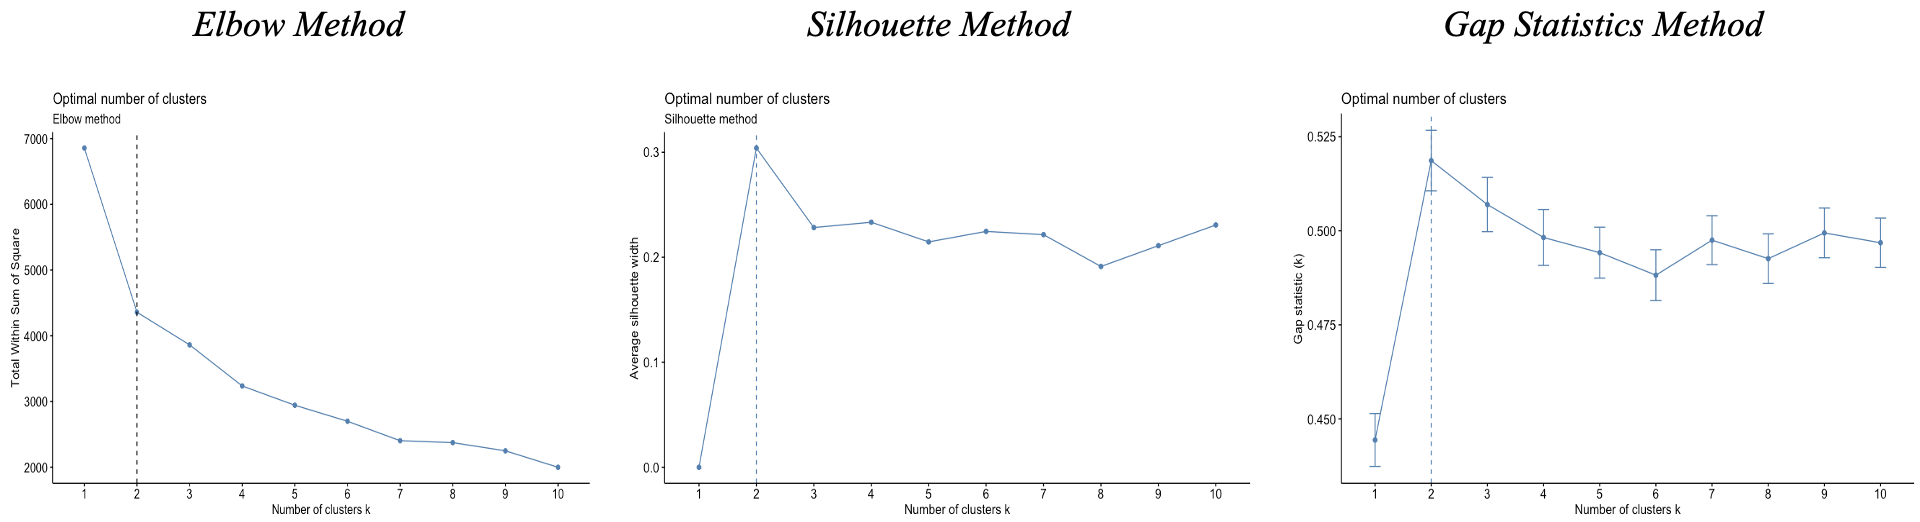
Not all of our sample indicated that payment systems hindered their purchasing decisions at farmers’ markets. Indeed, respondents were more likely to report willingness to purchase goods given credit card acceptance if they engage with farmers’ markets at least once a month (67.5%), were individuals with a higher income (62.3%), and were under the age of 34 (61.4%). To explore which latent segments of customers would be most likely to increase spending if payment systems were improved, we conducted a k-means cluster analysis. We use k-means clustering to identify market segments based on consumer payment data. Based on three optimization techniques, we conclude that k=2 is the optimal number of clusters. Figure 4 presents our results. Consistent with the literature (Kassambara, 2017), we consult several methods that assist in identifying the optimal value of k:
-
Elbow Method: The elbow method assesses the variation explained by the clustering algorithm for different values of k. It calculates the sum of squared distances between each data point and its assigned centroid, also known as the Within-Cluster Sum of Squares (WCSS). The WCSS is plotted against the number of clusters, and the graph typically resembles an arm. The optimal k occurs when the WCSS decrease begins to flatten out significantly, forming an elbow-like bend.
-
Silhouette Method: The silhouette method measures the clustering quality for various k values by considering the cohesion within clusters and the separation between clusters. It calculates the silhouette coefficient for each data point, with a high silhouette coefficient indicating that the data point is well-matched to its assigned cluster and poorly matched to neighboring clusters. The average silhouette coefficient for all data points is computed for each k value, and the k with the highest average silhouette coefficient is considered optimal.
-
Gap Statistics Method: The gap statistics method compares the within-cluster dispersion for different k values to a reference distribution. It computes the gap statistic, quantifying the deviation between the observed within-cluster dispersion and the expected dispersion under a null reference distribution. The reference distribution is created by generating random data points from a uniform distribution within the range of the original dataset. The optimal K is the value that maximizes the gap statistic, indicating a significant gap between the observed dispersion and the reference distribution.
These methods provide different perspectives on the optimal number of clusters and can be combined to gain more confidence in the choice of k. Figures 4a, 4b, and 4c illustrate how each of the three methods of determining k concludes that k = 2 is the optimal number of clusters.
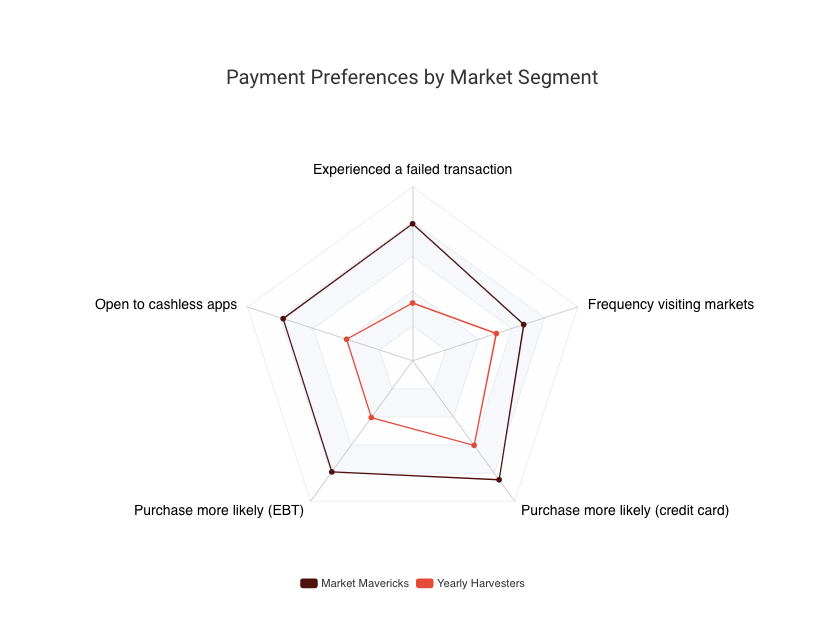
Results from these methods indicate that our sample can be split into two unique clusters. Table 4 presents the differences in payment preferences between our two clusters, and Figure 5 presents these differences in the form of a spider plot. The variation within each payment preference variable listed allows us to understand how the k-means algorithm grouped our survey respondents. 39.4% of respondents included in Cluster 1 reported having experienced a situation where they could not complete a transaction at a farmers’ market, compared to just 16.6% of Cluster 2 respondents. This difference can likely be explained by the differences in farmers’ market shopping frequency between the two groups. Cluster 1 respondents reported attending farmers’ markets multiple times a year on average, while Cluster 2 reported visiting farmers’ markets once a year on average. Respondents categorized in Cluster 1 also reported “probably yes” on average when asked whether they would be more likely to purchase products from a farmers’ market vendor if they accepted credit cards and EBT payments. Cluster 1 also responded “probably yes” on average when asked about willingness to use cashless payment apps such as Venmo, Cash App, and Zelle at markets. On the other hand, Cluster 2, on average, answered “neither agree nor disagree” when asked if they would be more likely to purchase goods from vendors that accept credit cards and answered “probably not” when asked the same question about EBT payment acceptance. Cluster 2 respondents also answered “probably not” on average when asked if they would use payment apps at farmers’ markets. Based on these differences in market visit frequency and responses to payment method availability, we call Cluster 1 “Market Mavericks” and Cluster 2 “Yearly Patrons.” In the context of our previously discussed transaction costs model for farmers’ markets, the preferences and behavior of Market Mavericks most closely resemble the early adopters, while the Yearly Patrons reflect most consumers.

Table 5 presents the sample demographics of both clusters. Market Mavericks comprised 47.2% of the total sample, while Yearly Patrons included 52.8%. We find statistically significant differences (at alpha = 0.05) in the geographic region, age, political affiliation, and food spending of our two clusters. We fail to find any meaningful difference between the market segments in gender makeup or household income. Market Mavericks are significantly younger, with an average reported age of 41.14 years, while the Yearly Patrons group has an average age of 55.2 years. Furthermore, Market Mavericks spend significantly more each week on average ($122.16 per week) on food than Yearly Patrons ($103.77 per week). Market Mavericks spend significantly more per week on food despite a lack of significant difference between the reported incomes of the two market segments. When asked whether they self-identify as “foodies,” Market Mavericks, on average, responded “neither yes nor no,” while Yearly Patrons, on average, answered “probably not.” Market Mavericks also include a much higher proportion of individuals who identify as Democrats (42.0%) than Yearly Patrons (29.7%). The Yearly Patrons cluster, in turn, has higher proportions of individuals who identify as Republicans, Independents, and other parties.
Discussion
Farmers’ markets face challenges due to their reliance on cash transactions amidst a consumer shift towards cashless options. Adopting digital payment systems presents an opportunity to boost revenue and improve access to local foods, aligning with evolving consumer preferences. Furthermore, transitioning to card payments can enhance revenue without requiring extensive marketing efforts. Our findings demonstrate that adopting e-payment systems offers small business owners in farmers’ markets an opportunity to enhance operational efficiency, reduce transaction costs, and significantly increase consumer engagement. This shift aligns with broader small business strategies to leverage technology to create a service innovation that meets evolving consumer preferences for transaction convenience. By integrating digital payment systems, small businesses can capture a larger share of existing consumers and expand their market by catering to new customer segments who prefer cashless transactions.
By identifying distinct consumer segments, this study provides small business owners with insights into the importance of strategically targeting different groups, such as the tech-savvy Market Mavericks, who are more likely to increase spending if digital payment options are available. This segmentation analysis offers a framework for small business owners to tailor their payment systems to meet the needs of diverse consumer groups, leading to enhanced customer satisfaction and higher sales. We also find that credit card payment availability in farmers’ markets is more common in urban counties and that counties without credit card availability at markets typically have lower median income, higher poverty rates, and higher proportions of the population over the age of 65. Future studies would benefit from an additional focus on the role of technology in improving the customer experience for at-risk groups, particularly as it relates to digital literacy and user comfort with technology (Neumeyer et al., 2020; Santos & Neumeyer, 2022; van der Cruijsen & Reijerink, 2024).
These findings indicate that consumers still conduct most farmers’ market transactions via cash, and there might be an opportunity to reduce barriers to purchase by offering additional payment options. This is unsurprising, as cashless options complement cash payments, though many customers are likely to prefer cash payments (Shy, 2023). Through market segmentation via k-means cluster analysis, we discover two distinct consumer segments based on their payment preferences. Consumers in the Market Mavericks group are younger, spend more on food, have a higher median income, and are more likely to identify as “foodies” than their Yearly Patron counterparts. Depending on a vendor’s consumer characteristics, these insights may help vendors and support organizations identify who benefits the most from adopting additional payment methods and how to reach these segments through outreach efforts. As such, future research might explore how different business models might adapt innovative payment systems (Ferreira et al., 2024; Popp et al., 2023).
Our findings regarding consumer spending at farmers’ markets should be interpreted with caution, as pre-existing consumer perceptions about the cost and availability of products could influence both the likelihood of adoption and the overall spending behavior. In particular, consumers in more price-sensitive segments, such as those in rural or lower-income areas, may be more hesitant to engage with higher-cost product offerings, potentially moderating the impact of cashless payment adoption on spending outcomes. Similarly, while our analysis explores household income and weekly food spending, we did not collect data on broader household budgets or competing financial expenditures that may limit spending on food. This represents a limitation of our study, as these factors could influence consumer behavior at farmers’ markets. Future research should explore this relationship by including more detailed measures of household budgets and competing expenses to understand better how financial constraints affect spending at local food markets.
That said, this study highlights the value of research that explores the cost associated with promoting small business growth via public funding for digital payment system adoption. Given the economic potential of e-payment systems, providing infrastructure improvements and incentives for adoption could foster greater financial inclusion and economic resilience in local food markets. By improving the customer experience through new payment options, vendors might gain a larger market share of the pragmatic locavores who prefer the benefits of eating locally but ultimately follow the path of least resistance. What seems like a small adjustment in farm operations could significantly impact the consumer experience and spending. With new payment systems, vendors might capitalize on the existing consumer base without additional marketing and reduce the barriers to reaching new consumers, ultimately increasing direct sales.
Building on this, adopting e-payment systems also represents an investment in service innovation that aligns with the broader goals of consumer-centric business strategies. For small firms operating in direct-to-consumer markets, e-payment technologies provide operational convenience by enabling additional customer engagement through enhanced service offerings. These innovations, such as loyalty rewards and pre-ordering options, allow vendors to meet and exceed evolving consumer expectations, fostering long-term customer loyalty. Furthermore, this investment responds to demographic shifts, targeting younger, tech-savvy market segments that value convenience and efficiency. By framing e-payment adoption as a service innovation choice, small businesses can position themselves to capture higher revenues, expand their market reach, and sustain competitiveness in an increasingly digital economy.
This loose definition means that there are likely major unaccounted-for differences in the number of vendors, types of vendors, consumers, and other characteristics between the markets documented in the Food Environment Atlas.
The USDA collects the data through a survey of the farmers’ market managers, so acceptance of payment methods is voluntarily reported at a market level rather than a vendor level. Vendors can also choose their transaction methods, so a farmers’ market may include vendors that accept credit cards and EBT and vendors that do not.