

Introduction
The importance of small and medium enterprises (SMEs) around the world is well established. SMEs makeup 95% of companies worldwide, employ 60%-70% of the total workforce (Lekmat et al., 2018), and account for over 80% of job growth and 70% of GDP in developed countries (Bruce et al., 2023). Despite their immense importance in the overall business landscape, SMEs are still highly impacted by the pace of competitive change and the unpredictable nature of the business environment. They must efficiently and effectively apply their limited resources to achieve success (Pascal & Shin, 2015). Additionally, managers and leaders of SMEs need to constantly reassess their strategic approach in the face of a dynamic and turbulent environment.
Seeking to provide small business leaders with knowledge of effective management approaches, we (Williams et al., 2018) found that three related management practices – goal setting, financial ratio analysis, and strategic planning – form a higher-order construct, which we labeled as a “comprehensive strategic approach (CSA).” We further demonstrated that CSA positively impacts small business performance. Small business and entrepreneurship researchers have cited that work over 70 times in the six years since its publication. Yet, no research has replicated this study. Therefore, the following questions surfaced: Would another study show a positive relationship between CSA and small business performance? Would another study with revised measures show a positive relationship between CSA and small business performance? Also, would a positive relationship between CSA and small business performance appear again in a dynamic business environment that is different from the original study?
The industry in which we study CSA – the printing industry – has experienced significant upheaval. The printing industry is highly turbulent and increasingly impacted by digital media replacing printed products such as direct mail, books, brochures, and others. It is projected that U.S. printing industry revenue will continue to decline in the coming years.[1] Additionally, COVID-19 exacerbated the challenges faced by all businesses. The printing industry was particularly impacted by “work from home” as fewer office materials were needed. Also, business events, conventions, and trade shows were canceled. It is believed that, on average, U.S. printing companies experienced a 20% drop in sales during the pandemic.[2] However, an industry report recently suggested that, on average, U.S. printing companies’ revenues have only rebounded 15% after the pandemic, less than the 20% COVID-19 drop (Williams, 2022).
Does the CSA higher-order construct still hold as formed from three lower-order constructs (goal setting, financial analysis, and strategic planning) in what some might consider a changing industry and in a new world order prompted by COVID-19? Might there be a more complete understanding of CSA’s potential impact on small business performance because of this dynamic environment? While many printing firms have struggled to adapt, others have flourished, primarily due to the ability to observe and react to external environmental factors with flexibility. This performance variance in a dynamic environment provides an opportunity to re-test CSA.
This study seeks to test CSA’s credibility as an emergent theory. We chose to replicate our previous study, seeking further evidence of CSA’s positive effect on small business performance. Successful replication adds credibility to previous research claims (Vazire, 2018). Additionally, we enhance the replication by applying stronger and deeper measures of both the strategic planning and financial ratio analysis constructs, which reflects conceptual replication. Before presenting our hypotheses and relevant literature, our next section provides an overview of replication.
Replication
Replication is the repetition of previous research, and repetition seeks to determine if the prior results are repeatable, have credibility, and are generalizable (Hubbard & Armstrong, 1994; Kugler et al., 2006). Replication is a “self-correcting science” (Köhler & Cortina, 2021, p. 490) focused on “confirming or adjusting our understanding of the world through repeated exploration of a phenomenon of interest (p. 488).” Highlighting the benefit and importance of replication, multiple management journals have published articles promoting and seeking replication studies [e.g., Academy of Management Journal (Eden, 2002), Journal of Management (Köhler & Cortina, 2021; O’Boyle et al., 2017), and Strategic Management Journal (Bettis, 2012; Bettis et al., 2016)]. Indeed, the Academy of Management Discoveries, a journal created by the Academy of Management, includes in its mission publishing important replication findings (Köhler & Cortina, 2021).
There are two types of research replication: “direct replication,” where the same methods and measures are applied; and “conceptual replication,” where methods or measures are changed to provide more supporting evidence (Derksen & Morawski, 2022; Machery, 2020; Nosek & Errington, 2020). “…a replication is conceptual if and only if it attempts to establish the same theoretical conclusion as an original experiment with different experimental manipulations or measures (Machery, 2020, p. 3).” In top management journals, conceptual replication is more common than direct replication (Köhler & Cortina, 2021).
Methodological deficiencies in previous research support the need for replication (Klonek et al., 2020). As discussed later, to explore the relationship between CSA and small business performance we applied different measures from those applied in our original study. We sought to see if measurement variance would affect the relationship found between CSA and small firm performance (Köhler & Cortina, 2021). In other words, would applying different measures affect the previous positive relationship found between CSA and small business performance in our previous study? Therefore, this work fits the conceptual replication paradigm. Furthermore, as we improved our measures, the present study is “constructive” (Köhler & Cortina, 2021, p. 496) with more methodological rigor. Accordingly, later we share the shortcomings of the measures applied in our previous study and provide more detail below about how the measures applied here differ from our previous study.
Hypotheses Cultivated from Literature
As this is a replication study, we apply the same four hypotheses as in our original study. Therefore, our literature review here is similar yet more concise than what was included in our original study. Where relevant, we review literature published since our first study.
Strategic Planning and Small Business Performance
Researchers have explored the relationship between strategic planning and firm performance for decades but found mixed results (Amoo et al., 2023; Evans et al., 2024; Molete et al., 2025; Powell, 1992; Wolf & Floyd, 2017). Some studies demonstrate a positive relationship between strategic planning and performance. Examples include Armstrong (1991), Berman, Gordan, and Sussman (1997), Andersen (2000), Elbanna (2008), Song, Im, Bij, and Song (2011), and Al-Shammari and Almutairi (2024). Other studies (Falshaw & Glaister, 2006; Pearce et al., 1987; Powell, 1992; Shrader et al., 1984) found weak, or inconsistent relationships between planning and performance. Amoo, Lodorfos, and Mahtab (2023) suggest that this inconsistency led some (such as, Miller & Cardinal, 1994; Mintzberg, 1978, 1991; Pearce et al., 1987) to reject formal strategic planning as too rigid and ultimately irrelevant to firm success.
In their meta-analysis of existing research on the strategic planning/performance relationship, Wolf and Floyd (2017) attribute inconsistent findings primarily to the absence of a solid theoretical foundation. This is most evident in the lack of consistent definitions and methods used to measure the performance construct. Amoo and colleagues (2023) echo this concern, arguing that researchers’ failure to clearly define and operationalize the key constructs in the planning/performance relationship has led to widespread issues with measurement error, as well as poor reliability and validity across studies. They also criticize the overly simplistic conceptualization of the planning–performance link, which has resulted in research designs that fail to capture the relationship’s inherent complexity.
A particularly problematic trend, according to Amoo, Lodorfos, and Mahtab (2023) (and others, Evans et al., 2024; Tefera & Abebe, 2024), is the common assumption of a direct link between strategic planning – typically focused on strategy formulation – and performance, often neglecting the crucial element of strategy implementation. As Amoo, Lodorfos, and Mahtab (2023, p. 1627) state:
“This implies that the issue of how the strategy was implemented is absent from this conceptualisation and operationalisation. It can, therefore, be concluded from the above that in the strategic planning-performance literature, the issues relating to strategy implementation have been neglected and treated as a black box or at best bundled with the strategy formulation aspect of the strategy process.”
This “black box” becomes especially problematic in the context of small and medium-sized enterprises (SMEs), where resource-constrained practitioners often rely on academic research to maximize the effectiveness of their strategic planning efforts. Yet, findings from strategic planning/performance studies in SME settings have often left small business owners with mixed messages. Some studies claim that structured planning enhances firm survival and growth (Delmar & Shane, 2003, 2004), while others suggest that planning may be unnecessary or even counterproductive in highly uncertain environments (Gruber, 2007; Karlsson & Honig, 2009; Mansoori & Lackeus, 2020; Shirokova et al., 2020)" (Nakajima & Sekiguchi, 2025, p. 2).
Much of this inconsistency stems from the previously mentioned challenges, but the SME context also introduces unique research difficulties. To date, most studies have focused on larger firms, often overlooking the specific resource and capability constraints that SMEs face. Even when small businesses are the focus, research tends to concentrate on narrow industries or geographic regions, limiting the broader applicability of the findings (Molete et al., 2025). Additionally, SME research has often ignored important contextual variables, such as how equipped small business owners are to both develop and implement a strategy effectively (Evans et al., 2024; Nakajima & Sekiguchi, 2025) and has failed to answer the fundamental questions of when and how business planning is beneficial to small and medium enterprises (Nakajima & Sekiguchi, 2025). The Comprehensive Strategic Approach (CSA) is offered as a means to address these and other questions related to demystifying the ‘black box’ of strategic planning for small businesses.
More recently, it appears consensus is building around the notion that strategic planning has a positive impact on firm performance (Chaib Lababidi et al., 2020; Rau et al., 2021; Vandersmissen et al., 2024; Vanhuyse et al., 2021). Hamann, Halw, and Guenther (2023) argue that the findings of their 183-study meta-analysis provide definitive evidence of a positive relationship between corporate planning (CP) and organizational performance (OP):
“In general, our meta-analysis provides a clear answer to a decades-old question: Does (corporate) planning pay? The answer is definitely yes. CP pays for different degrees of task interdependence across countries with different levels of uncertainty avoidance but also for different organizational sizes and levels of environmental uncertainty. The characterization of research on the CP–OP relationship as contradictory, weak, and fragmented (e.g., Greenley, 1994; Pearce et al., 1987) is no longer warranted.” (p. 1815)
George, Walker, and Monster (2019) are unequivocal in the summation of their 2019 meta-analysis findings:
“Mintzberg (1994) declared the fall of strategic planning (SP) a quarter of a century ago. Yet SP is clearly very much alive in contemporary organizations…Our meta-analysis indicates why it is still alive: it has a significant, moderate, and positive impact on OP. Clearly these findings suggest that opposition to SP is not supported by empirical evidence…” (p. 817)
Recent articles have tended to adopt a more contextual approach in investigating and describing the relationship between strategic planning and performance with the goal of understanding how, when, why, and to what extent strategic planning improves firm performance. George, Walker, and Monster (2019) suggest that the planning/performance relationship is consistently significant, but only when the planning is a formal process and identified goals focus on effectiveness rather than efficiency. Likewise, Hamann et al. (2023) suggest that while the relationship between planning and performance is positive and significant, the level of planning’s impact on performance is dependent on contextual factors such as industry, environmental stability, and top management uncertainty avoidance.
Other recent studies have suggested additional moderators of the strategic planning/firm performance relationship, including the following: organizational human and financial slack (Rau et al., 2021), entrepreneurial orientation (Williams et al., 2018), effectiveness of strategy implementation (Amoo et al., 2023; Bellamy et al., 2019; Vuong & Rajagopal, 2022), and configuration of the organization’s internal strategic ecosystem (Williams Jr et al., 2020). Recently identified mediators include employee strategic alignment (Ouakouak & Ouedraogo, 2013), organizational learning (Rau & Flores, 2021), top management and external stakeholder perceptions of performance (Vandersmissen et al., 2024), and organizational structure and environmental alignment with the planning process (Chaib Lababidi et al., 2020).
The strategic planning/performance relationship has proven equally robust in small business settings (Addae-Korankye & Aryee, 2021; Kraus et al., 2006; Sandada et al., 2014; Vanhuyse et al., 2021). Despite the resource limitations that hamper small businesses’ strategic efforts and understanding (Bellamy et al., 2019; Williams et al., 2018), Vanhuyse, Bailey and Tranter (2021) found a significant relationship between strategic planning and (financial) performance for farmers in England. Addae-Koranky and Aryee (2021) found a similar positive strategy/performance relationship result for small and medium businesses in Ghana, looking specifically at the impact of strategic formulation and implementation on SME growth. Given the preponderance of recent findings suggesting a positive planning/performance relationship, we hypothesize that:
- H1: Strategic planning positively affects small business performance.
Goal Setting and Small Business Performance
Researchers have extensively explored the relationship between goal setting and performance at the individual, group, and organizational levels, with more than 1000 studies conducted over recent decades (Seijts & Latham, 2012). Goals can affect performance in multiple ways. Goals can provide direction, energize, and affect persistence (Locke & Latham, 2002). Goals “affect action indirectly by leading to the arousal, discovery, and/or use of task-related knowledge and strategies” (Wood & Locke, 1990, p. 707). Goal-related energy is best generated by specific and challenging goals. Research consistently shows that specific and difficult goals yield greater motivation and better performance than vague, easy goals (Kleingeld et al., 2011; Locke & Latham, 1984). Most studies view a linear relationship between goal difficulty and performance; that trajectory fails only when the goal is perceived as impossible to achieve (Latham & Steele, 1983; Locke & Latham, 2002).
Despite the breadth of goal-related studies and relative consistency of findings suggesting a positive goal-setting/performance relationship, Aguilera, De Massis, Fini, and Vismara (2023) argue that “The relationship between goals and performance is complex and under-studied” (p.9). They cite the fact that the vast majority of prior (and current) studies are focused primarily on organizational-level financial goals, which is out of step with organizations’ increased attention to environmental, social, and governance (ESG) factors. The shifting landscape has spurred new interest in goals and goal setting, reflected in the 46 research articles published on this topic in the past three years alone (Aguilera et al., 2023). These new studies reflect the broader perspective on goals and seek to gain a deeper understanding of the antecedents, processes, and outcomes of the goals/performance relationship.
Examples of this recent shift include Kelliher, Murphy, and Harrington (2020), who suggest that goal setting affects performance indirectly, as a tool for strategic learning, particularly for owner-managers of small businesses. Raveendran, Srikanth, Ungureanu, and Zheng (2023) suggest that the impact of goal setting on learning happens at the individual level and that more challenging goals improve performance in learning tasks. Aquilera (2023) sees goal setting as a governance exercise, so it is important to understand who gets to create the goals and the system they derive from, as well as who has the responsibility to make sure the goals are achieved, work is assigned, and goal accomplishment is assessed. All of these will impact how well the organization’s goals match its mission/vision, how well they are executed, and ultimately how they impact performance.
Yitzhaky and Bahli (2021) suggest that target-setting in the goal-setting process is a critical predictor of firm and management performance, with transparency of the targets and level of managerial experience as moderators of the relationship. Finally, Obloj and Sengul (2020) test the validity of the Multiple Objectives Theory within the goal-setting/performance context. Multiple Objectives Theory suggests that “performance on a given metric increases when it is pursued as an objective (goal) but decreases with the number of other objectives pursued simultaneously” (p. 2518). The authors find that (consistent with theory), performance on any given dimension decreases with the number of other simultaneously followed goals, a regularity that is held across different types of organizations. That said, the authors found that setting goals across multiple dimensions is potentially beneficial as an integrating mechanism forcing firms to make trade-offs in real time between strategic choices. This is likely to be a factor in the overall impact of goal setting on performance, especially for larger small businesses.
The inevitable link between goal setting and strategic planning is well-established in the literature. Brinkmann, Grichnik, and Kapsa (2010) contend that by its very nature, “Planning implies the specification of goals and fosters the identification of effective steps to achieve these goals” (p. 27). Quinn (1977) adds, “[e]ffective strategic goals do more than provide a basis for direction setting and performance measurement. They are essential to establishing and maintaining freedom, morale, and timely problem sensing in an enterprise” (p. 29). Quinn’s observations align with studies showing that goal setting improves strategy implementation, enhances performance in complex settings (Chesney & Locke, 1991), and increases the speed and efficiency of internal decision-making in strategic business units (Kownatzki et al., 2013) and small businesses (Brinkmann et al., 2010). Finally, Doko (2024) suggests that there is a significant correlation between structured budgeting – a form of goal setting – and enhanced financial outcomes for small businesses. Given the potential positive effects of goal setting on strategic planning and studies supporting a link between goal setting and performance, we hypothesize that:
- H2: Goal setting positively affects small business performance.
Financial Ratio Analysis and Small Business Performance
Managers analyze financial ratios to assess financial results. Financial proportions or multiples potentially reveal more information than what is available from a scan of balance sheets, income statements, or cash-flow statements (Delen et al., 2013; Thomas & Evanson, 1987). Financial ratio examples include the following: gross margin as a percentage of sales, inventory turnover, net profit as a percentage of sales, current assets to current liabilities, total liabilities to net worth, return on equity, return on investment, days accounts receivable, days accounts payable, and others (Delen et al., 2013; Edmister, 1972; Isberg, 1998; Thomas & Evanson, 1987). Business leaders can enhance their grasp of liquidity, leverage, operating efficiency, and profitability through financial ratio analysis (Isberg, 1998).
However, research results regarding the financial ratio analysis/small business performance relationship are mixed. Through a qualitative exploratory business study, McMahon and Davies (1994) found no apparent association between financial ratio analysis and performance. In a quantitative study, Thomas and Evanson (1987) did not find a correlation between financial ratio analysis and small business profitability. Thomas and Evanson (1987) suggested two possible explanations for their lack of a financial ratio analysis/small business profitability relationship. Small business leaders may not understand and interpret financial ratios, and small business leaders may not be able to make effective decisions based on financial ratios. Although most small business leaders can acquire the ability to analyze financial ratios, apparently few do so. However, in recent decades, the development of hardware and software generating useable small business financial data may facilitate more effective small business financial ratio analysis (Halabi et al., 2010).
Nonetheless, Dahmen and Rodríguez (2014) found a positive relationship between small business leaders’ financial evaluation, which included financial ratio analysis, and firm performance. More recently, Prawirodpoero, Rahadi, and Hidayat (2019) suggest that the use of financial ratio analysis can improve the financial performance of MSMEs[3] in Indonesia. Likewise, Zada, Yukun & Zada (2021) found that the incorporation of financial analysis into the SME planning processes improved performance (measured as growth) in Pakistan. Mahohoma (2024) reports a positive relationship between financial management skills (including basic financial ratio analysis) and performance on construction projects in small businesses in South Africa. Finally, while not directly investigating the financial ratio analysis/SME performance relationship, several studies identified financial ratios that predicted SME success or failure in various emerging markets [Abdelkader & Wahba (2024) in Egypt; Le & Nguyen (2020) in Vietnam; Sreenu (2016) in India; Wolmarans & Meintjes (2015) in South Africa].
Given the potential advantages financial ratio analysis may provide a small business, the increased and enhanced availability of financial data for small business leaders, and the positive results reported by Dahmen and Rodriguez (2014), Prawirodpoero et al. (2019), Zada et al. (2021) and others, we hypothesize that:
- H3: Financial ratio analysis positively affects small business performance.
Comprehensive Strategic Approach
Hierarchical component models encompass two construct layers: higher-order components and lower-order components. Higher-order components capture abstract constructs, and lower-order components capture subdimensions of higher-order components (Hair et al., 2022; Wetzels et al., 2009). We next discuss the higher-order component developed and examined in this replication study, a comprehensive strategic approach (CSA).
Strategic planning is a facilitating process that enables consideration of reasonable options, provides a roadmap for accomplishing organizational goals, integrates a firm’s goals with a roadmap of actions directed at achieving those goals, and enhances internal communication and interaction (Kellermanns & Eddleston, 2006; Powell, 1992). Early planning scholars (e.g., Andrews, 1971; Ansoff, 1965; Armstrong, 1982; Porter, 1985) included in their business planning description the following components: the designation of goals, the generation of a plan to accomplish those goals, and the evaluation as well as implementation adjustment of goal accomplishment plans (Brinkmann et al., 2010). Effective financial ratio analysis also relates to setting business goals and articulating a strategy to obtain those goals (Isberg, 1998). Therefore, we propose the three lower-order components in our model (goal setting, strategic planning, and financial ratio analysis) together form a higher-order component, a comprehensive strategic approach (CSA). Thus, we hypothesize that:
- H4: Strategic planning, goal setting, and financial ratio analysis form a higher-order component (CSA - a comprehensive strategic approach).
Based upon the literature previously reviewed, the combination of goal setting, strategic planning, and financial ratio analysis – a comprehensive strategic approach – has a positive effect on small business performance. Thus, we hypothesize that:
- H5. Comprehensive strategic approach positively affects small business performance.
Methods
Sample and Data Collection
Replication is best conducted in contexts that differ from that of the original study (Seyedghorban et al., 2016). However, in the present study, we drew our sample from the same domain as our original study, the printing industry. Printing companies may produce a wide range of printed materials, including direct mail marketing materials, books, posters, catalogs, magazines, transactional statements, or packaging labels. Two reasons support our use of the printing industry in the present study.
First, industry research shows that the printing industry is very diversified, consisting of a wide range of strategic groups. A strategic group is described as a logical cluster of firms segmented as “a small subset of direct rivals” (Carroll & Thomas, 2019, p. 505). Companies in a strategic group focus on providing a target market with products and services; companies in different strategic groups target different markets with different products and services. Recent printing industry research (Williams & Fowler, 2023) and academic research (Williams et al., 2025). found the presence of different strategic groups in the printing industry. Different printing industry strategic groups may focus on books, product labels, direct mail, or general commercial printing (brochures, calendars, posters, catalogs, etc.). While our sample is drawn from a single industry, that industry is strategically very diverse.
Second, the printing industry is challenged, but high-performing printing firms still exist. The following is a five-forces assessment (Porter, 1980) of the printing industry. At the end of each force’s assessment, we state the force as “high,” “medium,” or “low.”
-
Competitive rivalry – typically, there are multiple printing companies in each city, which enhances competitive rivalry. (high)
-
Powerful buyers – given the number of printing companies available, the ease of finding other printing companies online, and low switching costs, most buyers do have power. (high)
-
Powerful suppliers – given the cost of updating paper mills, growing environmental regulations, and concern for printing paper’s future demand, multiple printing paper mills have closed. Also, with the growing demand for home delivery of online orders, multiple printing paper mills have converted to producing corrugated. With the printing paper supply declining, this force in the printing industry has become more powerful in recent years, resulting in periods of significant price increases and problems in procuring printing paper (Zeiser et al., 2023). (high)
-
Potential new entrants – as the printing industry is not attractive, there are few companies entering the industry. (low)
-
Substitute products – social media, e-newsletters, emails, and other online communication tools provide viable printing material substitutes. (high)
Four of the five forces described above paint a challenging picture for printing companies. Porter stated, “the collective strength of the forces determines the ultimate profit potential in the industry” (1980, p. 3). However, from industry reports it appears a significant portion of printing companies are performing well. In a recent industry report, the average EBITDA of 35 printing companies (from a sample of 104 printing firms) exceeded 18%, and the average EBITDA for all 104 firms was just over 11% (Williams Jr et al., 2023). It appears there are strong-performing printing firms in that challenging industry environment, and industry reports suggest significant variation in performance. Therefore, we saw the printing industry as a good place to explore the relationship between CSA and performance.
Utilizing Qualtrics® online software, we deployed a survey to printing companies located across the United States. We screened respondents to ensure that only company owners or upper-level managers were included. The average respondent firm had sales averaging $15.683 million annually and 70 employees, thus qualifying them as small businesses based on the United States Small Business Administration’s (www.SBA.gov) specified size standards.
After cleaning the data, a total of 174 usable responses remained. This exceeds the recommended minimum sample of 166 for a statistical power of 80% with a significance level of 5% and a minimum R2 of 0.10 (Hair et al., 2023). The inverse square root method recommends a lower minimum sample size of 116 (Kock & Hadaya, 2018).
Measures
As the present work is a replication, we describe the measures applied here and compare them to the measures we previously applied.
Strategic Planning
In our previous work, to measure strategic planning we applied three survey items used by Eddleston, Kellermanns, and Sarathy (2008) and Kellermanns and Eddleston (2006) as altered from Gould (1979). Those Likert scale items addressed three points: “We have a strategy for achieving our business goals,” “We have a plan for our business,” and “We know what we need to do to reach our business goals.” Seeking a better view of the extent to which a company applied strategic planning, in the current survey we utilized Piercy and Morgan’s (1994) measures. The measures applied in the present study examined the extent to which respondents identify targeted customer groups, identify the value brought to targeted customer groups, have a strategy for achieving business goals, analyze the business environment, and study competitors. This is a deeper exploration of strategic planning than applied in our previous study.
Goal Setting
In our previous study we applied three items to measure goal setting that were adopted from prior research (Powell, 1992; Robinson & Pearce, 1983). These measures explored the following: the presence of long-term goals and the extent to which those goals are known by all managers; the presence of short-term goals and the extent to which those goals are known by all managers; and the emphasis on formulating achieving goals in the competitive environment. We utilized these same measures.
Financial Ratio Analysis
To assess the extent of financial ratio analysis in our first study, we applied industry-specific measures. At that time, the Printing Industry of America (PIA - a national printing industry trade association) conducted annual “ratio studies” from which they provided printing company leaders with financial benchmarks. In our first study, we inquired about the extent to which participants participated in the PIA ratio studies, analyzed the reports, and applied knowledge from the reports in strategic thinking. However, in the present study, to take a deeper look we utilized five specific financial ratios (current ratio, debt-to-assets, net profit margin, return on equity, and sales to total assets) and asked the extent to which participants analyzed each. We drew the financial ratios from Leach and Melicher’s (2020) Entrepreneurial Finance text. We see the utilization of five specific financial ratios here as a more robust indicator of financial ratio analysis than the simple application of industry benchmarking as in our previous study.
Small Business Performance
There are numerous inconsistencies in small business accounting. Thus, accurately assessing small business performance is a well-documented research problem (Eddleston & Kellermanns, 2007; Love et al., 2002; Manley et al., 2021). Small business accounting methodologies vary. Also, small business accounting is not monitored and audited as in publicly traded firms, and owners sometimes “tweak” accounting by taking nonnormal expenses to reduce their tax burden. Therefore, assessing small business performance through objective measures is a research challenge. To address this issue, we applied subjective performance measures, which is consistent with multiple other studies (e.g., Eddleston & Kellermanns, 2007; Kaynak, 2003; Williams Jr et al., 2020; Williams et al., 2018). Prior research shows a strong correlation between subjective and objective financial measures (Dess & Robinson, 1984; Venkatraman & Ramanujam, 1986). We applied the same subjective financial performance measures in the present study as in our previous study. Using a five-point Likert scale anchored by “Much Worse” and “Much Better,” we asked survey respondents to assess their firms’ performance relative to competitors using seven indicators. Taken together, these seven indicators serve as a proxy measure of firm financial performance.
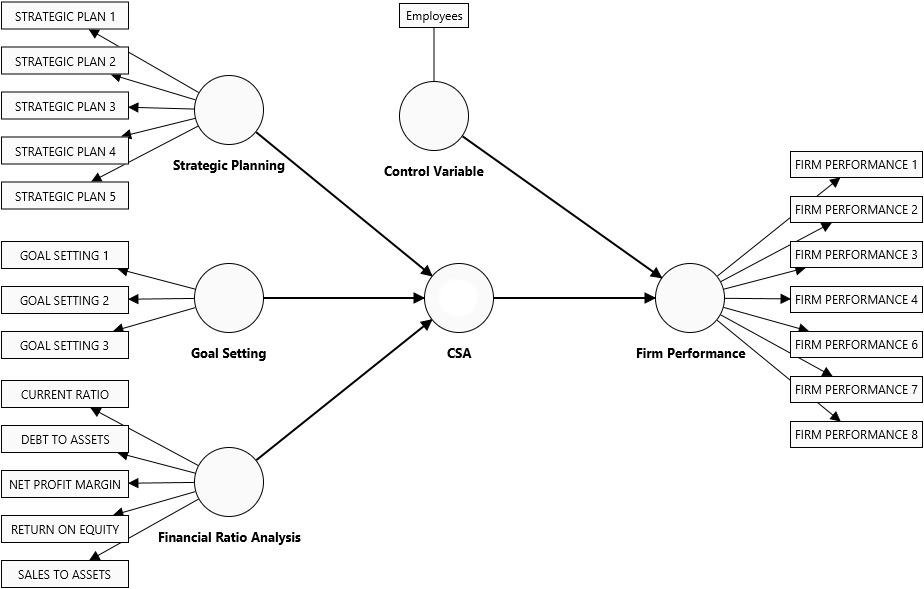
In summary, we applied the same small business performance and goal-setting measures here as in our first study. However, the strategic planning and financial ratio analysis measures applied here were revised to provide a deeper and better assessment of those constructs, thereby enhancing this replication study. Our measurement model in this study utilizes five indicators of strategic planning, three indicators of goal setting, five indicators of ratio analysis, and seven indicators of firm performance. All measures are listed in Table One below in our measurement model section.
Control Variables
Researchers frequently assess the impact on the dependent variable of interest by incorporating controls for other variables, aiming to mitigate potential influences and reduce bias in their findings that might arise if such controls were not included. Consistent with prior research, we initially controlled for firm size based on the number of employees and total annual revenue. However, the path coefficient from size in sales to firm performance was 0.064 (p = 0.487). Thus, our results control for firm size based only on the number of employees.
Analysis
To assess our measurement and structural models, we utilized partial least squares structural equations modeling (PLS-SEM). PLS-SEM is preferred for exploratory research when the primary statistical objective is prediction (Hair et al., 2022). PLS-SEM is also preferred when the model includes higher-order constructs (Hair, Black, et al., 2019; Hair et al., 2022; Hair, Manley, et al., 2019; Manley, 2015; Manley et al., 2022; Sarstedt et al., 2020; Williams et al., 2018, 2020). We specified the comprehensive strategic approach (CSA) higher-order construct (HOC) as reflective-formative in accordance with Hair, Howard, and Nitzl’s (2020) guidelines. CSA is comprised of three lower-order components (LOCs): strategic planning, goal setting, and financial ratio analysis, thereby necessitating our utilization of PLS-SEM.
Two additional reasons support our use of PLS-SEM. First, the sample consists of small, closely held entrepreneurial companies (Manley et al., 2021). Second, the measurement model incorporates numerous items that can be weighted uniquely – according to their measurement contribution – instead of equally. The latter is a substantial limitation of the sum scores or averages utilized in regression (Sarstedt et al., 2020). For these reasons, we concluded that PLS-SEM was appropriate for this study.
Results
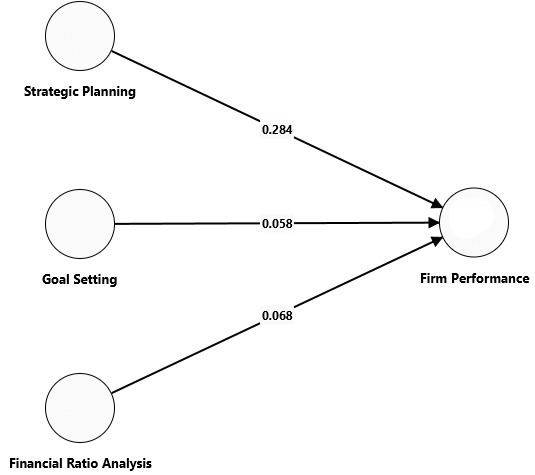
To test the measurement and structural models, we utilized SmartPLS 4 (Ringle et al., 2024). As this study seeks to replicate the prior research of Williams Jr, Manley, Aaron, and Daniel. (2018), we first tested the relationships between strategic planning, goal setting, ratio analysis, and firm performance. The measurement models include twenty indicators: five measures of strategic planning, three measures of goal setting, five measures of ratio analysis, and seven measures of firm performance. Applying the confirmatory tetrad analysis option in SmartPLS confirms that the lower-order constructs are appropriately considered reflective. The structural model, showing the path coefficients for each relationship, is shown below in Figure 1.
Simple model results
Measurement model evaluation
We followed the confirmatory composite analysis process recommended by Hair et al. (2020). Given that this simple model contained no higher-order constructs, we concentrated on first assessing the measurement model before examining the structural model relationships. Specifically, we assessed the indicators’ outer loadings, as well as the composite reliabilities and average variance extracted (AVEs) for each construct. Composite reliabilities for strategic planning, goal setting, ratio analysis, and firm performance were 0.846, 0.827, 0.949, and 0.917, respectively. Similarly, AVE values were 0.571, 0.731, 0.597, and 0.637.
To assess the significance of the indicators, we utilized the bootstrapping algorithm in SmartPLS, specifying 10,000 subsamples. All indicators were significant, with most p-values < 0.000. For the financial ratio analysis construct, the highest p-value was for the sales-to-assets indicator, with p = 0.021. Utilizing the recommendations of Hair, J. F., Jr., Sarstedt, M., & Ringle, C. M. (2019), we confirmed reliability, convergent validity, and significance for each construct. We next examined the HTMT ratios to establish discriminant validity for each construct. Because we are replicating the original work of Williams Jr. et al. (2018), the reliability and validity numbers shown in Tables 1 & 2 that follow are for the higher order construct model shown in Figure 2 rather than for the simpler model shown in Figure 1. Nonetheless, having established reliability, convergent validity, significance, and discriminant validity, we next evaluate the structural model.
Structural Model Evaluation and Hypotheses 1-3 Test Results
Like Williams Jr, Manley, Aaron, and Daniel (2018), only one of the three constructs of interest had a significant positive effect on firm performance. The path coefficients and p-values for the effects of strategic planning (H1), goal setting (H2), and financial ratio analysis (H3) on firm performance were 0.284 (p = 0.006), 0.058 (p = 0.571, n.s.), and 0.068 (p = 0.579, n.s.). Thus, of hypotheses one, two, and three, only hypothesis one was supported. The finding that strategic planning has a significant positive effect on firm performance is somewhat surprising, given that Williams Jr, Manley, Aaron, and Daniel (2018) instead found a significant positive effect only between goal setting and firm performance. To better understand this finding, we tested the relationship between goal setting and firm performance independent of strategic planning and financial ratio analysis, which yielded a path coefficient of 0.302 (p=0.000). Nonetheless, because the primary focus of the current study is a replication of the comprehensive strategic approach higher-order construct, we next examine the higher-order construct model.
Higher-Order Model Results
Measurement Model Evaluation
Again, we followed the confirmatory composite analysis process recommended by Hair et al. (2020) and Manley et al. (2021). The theoretical model contains one higher-order CSA construct. The lower-order constructs of strategic planning, goal setting, and financial ratio analysis were specified as reflective, with the higher-order construct as formative (Sarstedt et al., 2020).

The three lower-order constructs measure relative concrete constructs that together form the abstract CSA higher-order component (Becker et al., 2012). We first confirmed the reliability and validity of the reflective indicators of the lower-order constructs. Specifically, we assessed the outer loadings, composite reliability (rho alpha), average variance extracted (AVEs), and HTMT ratios to ensure discriminant validity.
To assess the measurement model, we utilized the requirements set forth by Hair et al. (2019). To assess the size and significance of the outer loadings, we utilized the bootstrapping algorithm in the SmartPLS software specifying 10,000 subsamples. All indicators were significant, with p-values <0.000. Composite reliabilities for strategic planning, goal setting, and financial ratio analysis were 0.827, 0.819, and 0.876, respectively. The AVEs for the lower-order constructs were 0.573 for strategic planning, 0.731 for goal setting, and 0.662 for financial ratio analysis. We thus confirmed the reliability, convergent validity, and significance of each of the lower-order constructs in our model.
To establish the distinctiveness of each construct, we examined the Heterotrait-Monotrait (HTMT) correlations (Henseler et al., 2015). The highest of the HTMT ratios, between goal setting and strategic planning (0.893), was still within the outer guidelines according to Hair et al. (2019). All other correlations were well below the recommended maximum. Again, utilizing the bootstrapping algorithm with 10,000 subsamples, we found that none of the values in the confidence intervals were equal to one. Having established discriminant validity, we also considered the nomological validity of the constructs with all other constructs in the nomological net (Hair et al., 2020). The preliminary findings are all consistent with the expected direction, size, and significance of the correlations, thereby establishing nomological validity (Hair et al., 2020).
We next assessed convergent validity of the formative higher-order construct comprehensive approach by following the recommendations of Hair et al. (2019) and Hair et al. (2022). We selected a single-item measure of strategic planning (Strategic Planning 3) and executed a redundancy analysis relating the single-item measure to the higher-order CSA construct. Doing so yielded a path coefficient of 0.840, with an upper boundary of 0.876 and a lower boundary at 0.813 at the 95% confidence level. This supports convergent validity of the CSA higher-order construct (Hair et al., 2022).
To assess collinearity between the indicators of the lower-order constructs, as well as the significance and relevance of the outer loadings, we examined the VIF values (Sarstedt et al., 2020). All values are below the maximum level of 5.0, and all but three of the values are below the recommended level of 3.0. Finally, all indicators (lower-order constructs) of the formative higher-order construct comprehensive strategic approach are significant and meaningful in size. The full measurement and structural model are shown in Figure 3.
Structural Model Evaluation and Hypothesis 4-5 Test Results
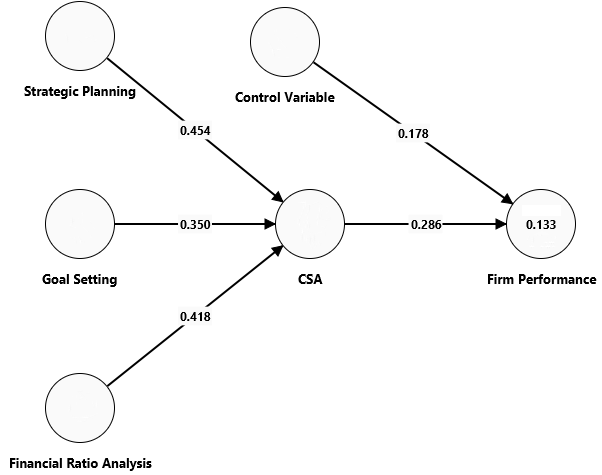
Again, following the CCA process outlined by Hair et al. (2022), we next assessed the structural model. All indicators (lower-order constructs) of the formative CSA-HOC are significant and meaningful in size. Specifically, the path coefficients between strategic planning, goal setting, and financial ratio analysis are 0.454, 0.350, and 0.418, respectively, with all p-values = 0.00. Thus, hypothesis four was supported. The path coefficient between the higher-order construct CSA and firm performance was 0.286 (p=0.005), yielding an r2 value of 0.133. Thus, hypothesis five was also supported. Finally, the path coefficient between the control variable (size in employees) and firm performance was 0.178 (p=0.011) while the path coefficient between size in sales and firm performance was 0.064 (p=0.487).
To assess in-sample predictive validity, we examined the f2 value (effect size). The f2 value of 0.111 for the impact of CSA on firm performance falls into the small to medium range (Cohen, 1992). To assess out-of-sample predictive validity, we utilized the PLSpredict algorithm in the SmartPLS software (Shmueli et al., 2019), applying the 10-fold and 10-repetition options. The positive Q2 values suggest that the model has good out-of-sample predictive power. Finally, we compare the root mean squared error (RMSE) to the linear model (LM) errors. Our results, below in Table 4, show that all PLS values are lower than the LM values. Thus, we conclude that our structural model has high out-of-sample predictive power (Manley et al., 2021; Shmueli et al., 2016, 2019).
In summary, through this replication with revised strategic planning and financial analysis measures, we found again that strategic planning, goal setting, and financial analysis form a higher-order construct, CSA. And again, we found a positive relationship between CSA and small business performance.
Closing Discussion
In this study, we attempted to replicate the findings of the original CSA paper from 2018. We updated and improved the measures from the original paper. Our results lend further support to the original findings: strategic planning, goal setting, and financial analysis form CSA, which in turn has a positive relationship with small business performance. The positive CSA/small business performance relationship suggests causality, which merits future research as discussed below. Based on findings consistent with the original study, the original study’s attention and citations since 2018, and the results of our current replication in a dynamic and post-COVID-19 environment, we assert that CSA is a concept that should be viewed as an emergent theoretical framework.
Why do we think CSA should be viewed as a theory? When considering replication, one of two outcomes will occur: results consistent with a prior claim would increase confidence in the claim, OR results inconsistent with a prior claim would decrease confidence in the claim. Replication findings consistent with prior research increase confidence in the previous work’s assertations (Nosek & Errington, 2020). As one could reasonably expect, successful research replication (where previous results are confirmed) is not a universal outcome. Indeed, multiple authors share that depending on the field, one-third to one-half of replication studies fail to successfully replicate the previous study (e.g., Camerer et al., 2016; Derksen & Morawski, 2022; Machery, 2020; Nosek & Errington, 2020). Despite the relatively high unsuccessful replication rate, academic articles often still call for replication (Morrison et al., 2010), many times in different contexts and across time. Our replication results are particularly robust due to the highly turbulent industry in which we replicate by applying similar yet improved measures.
Since our prior work in 2018, there have been numerous advances in the PLS-SEM method and its application and interpretation. For example, the HTMT criterion (Henseler et al., 2015) for establishing discriminant validity has completely supplanted the previously used Fornell & Larcker (1981) criterion. Shmueli et al. (2019) developed and validated their PLSpredict algorithm to assess out-of-sample predictive validity. Sarstedt, Hair Jr., Ringle, Nitzl, and Howard (2020) now recommend examining the VIF values to assess the collinearity of lower-order constructs. Hair et al. (2020) developed the confirmatory composite analysis protocol to ensure that measurement and structural models are correctly specified and interpreted. Finally, as noted by Manley et al. (2021), there has been considerable growth in the utilization of PLS-SEM by entrepreneurship and small business researchers.
In the context of many unsuccessful replications, “…declaring that a study is a replication is a theoretical commitment (Nosek & Errington, 2020, p. 7.” Conceptual replication builds knowledge (Seyedghorban et al., 2016) and is the “proper way to bolster and extend a theory (Derksen & Morawski, 2022, p. 1491).” Given the present study successfully replicates our original CSA study in a dynamic business environment and that CSA has been confirmed across various industries (Manley et al., 2022), we argue that CSA is generalizable. The generalizable nature of CSA is further reinforced by the present study’s constructive approach: improved measures and qualitative exploration. Therefore, from an ontological view of strategic planning, goal setting, and financial analysis… and an epistemic view of CSA studies, we propose that CSA is an emergent theory:
A comprehensive strategic approach – strategic planning, goal setting, and financial analysis, applied together – positively affects small business performance.
Practitioner Implications
The replication of the previous study has important practitioner implications as well (Klonek et al., 2020). Acknowledging that CSA is positively related to small business performance, but effectively and concurrently executing strategic planning, goal setting, and financial analysis is another step. A practitioner may draw specific execution suggestions from our strategic planning, goal setting, and financial ratio analysis measurement items (see Table One).
Related to strategic planning, small business leaders may seek to analyze the business environment, study competitors, identify targeted customer groups, identify the value their firm provides targeted customer groups, and develop a strategy for achieving business goals. We have seen successful small businesses that proactively addressed these strategy items. Quarterly, the small business leaders stepped aside to discuss these points, and they recorded thoughts for future consideration. Consider a small business in the lawn-care industry. Strategic discussions addressing the points above may prompt the business to pursue commercial or business lawn care instead of residential.
Making “goals known to all managers” (a phrase from our measures) is a goal-setting execution point small business leaders may draw from our work. If a small business leader shares written long-term and short-term goals with his or her team, the firm may experience more collective goal commitment. Also, communicating goals may prompt constructive and helpful feedback. Consider a small business selling hardware through a few local stores. Communicating goals to the entire team may help keep the stores in a common strategic direction.
Our financial analysis measures applied five ratios: current ratio, debt to assets, net profit margin, return on equity, and sales to assets. From our perspective, a relatively small proportion of small business leaders understand these ratios. For instance, a plumber who starts a plumbing business likely has not had financial ratio training. Our findings may prompt small business leaders who are not familiar with financial ratios to seek related training by attending seminars. This might help them see trends and apply financial ratios as “key performance indicators” for the firm’s strategy and goals, which reflects CSA.
Furthermore, enhancing CSA’s validity through replication as an effective small business management tool provides practitioners more confidence in applying CSA.[4] Practitioners can see the value of each CSA element (strategic planning, financial ratio analysis, and goal setting), but this replication reinforces the value of investing time and resources, as described above, into the three CSA elements Concurrently. Strategic planning, financial ratio analysis, and goal setting are synergistic.
Limitations
The present replication study has its limitations. First, it was replicated in the same (printing) industry. However, we believe this is not a fatal flaw due to the passage of time (2018-2024), the turbulent nature of the industry, and the global pandemic that occurred between the two studies. Nevertheless, one may see this dynamic and challenging environment as a limitation. Would that environment magnify the positive relationship between CSA and small business performance? In other words, in that challenging environment, is there a greater performance difference between applying CSA and not applying CSA? Also, as discussed in our methods section, the printing industry is very diverse, with multiple strategic groups (Williams et al., 2025).
Nevertheless, another study (not our original study) applied data from multiple industries to confirm CSA as a high-order construct that interacts with total quality management (TQM) to positively impact small business performance (Manley et al., 2022). In that CSA/TQM study, Qualtrics® was used to collect data from small businesses from a variety of industries: “The sample represented a broad cross-section of respondents from the retail, service, wholesale, manufacturing, and construction industries (page 1260).” These findings employing small businesses from a variety of industries suggest the generalizability of our replication findings that CSA has a positive effect on small business performance.
Second, independent replication is conducted by a different set of authors, not the same authors who conducted the original study. The present study is a dependent replication. The same authors conducted the 2024 replication of the 2018 study (Köhler & Cortina, 2021). Some may see this as a limitation with a bias applied or the lack of expanded thinking, which may affect study design choices or statistical analysis (Köhler & Cortina, 2021). However, previous analysis indicates that two-thirds, or more, of management replications are dependent (Köhler & Cortina, 2021).
One way to reduce potential bias in dependent replication is preregistration, entering research intentions on websites such as https://clinicaltrials.gov/ or https://osf.io/ (Nosek et al., 2018). In preregistering their study’s goals and planned approach, authors ensure their findings are not post hoc. Unfortunately, as we learned about preregistration after our study was completed, we did not preregister this work. However, we propose our application of the exact same hypotheses and methods (PLS-SEM) in this replication as were applied in our original CSA study indicates our findings were not post hoc.
Another potential concern with dependent replication is that of endogeneity. Sande and Ghosh (2018) suggest that when using cross-sectional data endogeneity is less of a concern depending on the nature of the independent variable. They further suggest the use of SEM may ameliorate those concerns, such as the incorporation of theoretically justifiable and relevant constructs as well as the use of control variables. Manley, Hair Jr. Williams Jr., and McDowell (2022) and Williams, Manley, Aaron, & Daniel (2018) considered the interaction between CSA and other constructs. In the former, CSA served as a moderator of the relationship between TQM and firm performance. In the latter, it was hypothesized (but not supported) that entrepreneurial orientation (EO) would moderate the relationship between CSA and firm performance. As a pre-condition for moderation, CSA was related to neither EO nor TQM. Both studies incorporate control variables such as firm size and industry. Because CSA has been considered alongside other important strategic management frameworks – namely EO and TQM – we suggest that concerns about endogeneity are minimal.
Finally, we also believe the robustness of our statistical analysis and the intuitive nature (they make sense) of our findings support our study’s integrity. We were seeking to “…convince ourselves that we are not dealing with a mere isolated ‘coincidence’, but with events which, on account of their regularity and reproducibility, are in principle inter-subjectively testable (Popper, 2005, p. 23, as quoted by Köhler & Cortina, 2021, p. 510.”
Future Research
CSA provides ample opportunities for further examination and development. The present study was a dependent replication, conducted by the previous authors. We invite other authors to conduct independent replications. Additionally, studying CSA in other industries would enhance the robustness and generalizability of the present findings.
Our finding of a positive relationship between CSA and small business performance suggests causality. However, future research is needed to validate a CSA/small business performance causal relationship. For instance, researchers may apply a qualitative study of small businesses applying CSA, seeking a causal relationship (i.e., the stories of small businesses applying CSA and how that affected their performance.)
Furthermore, future research might explore in what environments the CSA/small business connection is strong. For instance, is the connection stronger in businesses that provide services or in businesses that provide products? Does a highly competitive environment enhance the CSA/small performance relationship? Does small business size or stage (startup or mature) moderate the CSA/small business performance relationship?
Future longitudinal CSA studies may contribute related and helpful knowledge. Does the CSA/small business connection last over an extended time frame? And, importantly, what are the keys to implementing CSA? Certainly, future research can build on the foundation of our original CSA study and replication.
https://keypointintelligence.com/keypoint-blogs/how-the-printing-industry-is-surviving-the-pandemic
Micro, Small, and Medium Enterprises (MSME) is a classification based on Indonesian law.
We seek to share these results with practitioners through various outlets.