Introduction
Most businesses spend more than half of their allocated budgets on customer acquisition (Optimove, 2023; Weinstein, 2002), rather than investing in long-term relationships with existing customers. Small firms typically cannot outspend enterprise competitors in attracting new customers; they must find alternative paths for growth. This study examines one such path: the drivers of customer retention accumulating over visits. Our research was prompted by an earlier study on the relationship between device type and online conversion, which found a fourfold conversion advantage for returning users over new customers (Black, 2024). This large gap between new and returning customers belies traditional views of how customer value accrues. As such, this research explores how customer value differs by customer type using web interaction data from an online alcohol retailer operating in 42 U.S. states.
Alcohol retailers, like others in high-consideration e-commerce verticals, share characteristics such as long consideration cycles (Gupta et al., 2023) and barriers to conversion due to trust issues (Meriç & Yıldırım, 2021). Customers buying alcohol online face a few barriers to purchase, including age verification, privacy, and social stigmas.
Notable differences emerge between new customer conversion rates (1.76%) and repeat customer conversion rates (7.41%). Repeat visitors make up 23% of our traffic but account for 60% of our revenue. Many conventional methods that attempt to gauge online metrics assume linearity with session effects. Put simply, all visits are treated equally. However, our findings suggest otherwise. Sessions taken towards the end of a session chain (sessions 3-6) had greater value than sessions 1 and 2. We utilize Cognitive Appraisal Theory (Lazarus, 1991) to help explain why. Cognitive Appraisal Theory suggests that satisfied customers of an e-commerce platform will move from primary appraisals (“Is this website trustworthy? Is purchasing from this site safe?”) to secondary appraisals (“What products would suit my needs at this moment? Do they have any sales?”). Consumers often use different devices, which leads them to appraise at different phases of the purchase funnel. Smartphones are used for discovery and browsing at the beginning of the funnel, whereas consumers use a desktop for the latter stages, conducting thorough assessments of their decisions and making the purchase (Han et al., 2022). Mobile sessions are better thought of as trust-building, where desktop sessions drive conversion. Each device offers a distinctive role in the conversion journey.
In this study, we draw on clickstream data from 126,335 verified customers to test whether session effects compound differentially for new and returning users and quantify how the value premium compounds over the course of the customer journey.
Literature Review and Hypotheses Development
Digital Touchpoints and Customer Journey
Online shoppers go through multiple touchpoints, from their initial search through to placing the order (Court et al., 2009). Online businesses analyze clickstream data to examine page visits, session frequency, and product interactions to predict conversions (Bucklin & Sismeiro, 2003; Moe, 2003) and improve website functionality.
Existing research generally assumes homogeneous effects on different consumer groups. High-consideration categories make this assumption untenable. Purchase barriers in these categories change customer behavior and decisions. When customers view the shopping experience as exceeding their threshold, they will conduct additional searches (Dowling & Staelin, 1994; Ha, 2002). In an online context, additional searches become repeat visits, longer browsing time, and taking longer to purchase. These digital touchpoints and brand experience help identify where the shopper is on their customer journey (Lemon & Verhoef, 2016). In higher-barrier-to-entry categories, new and returning users’ conversion rates differ sharply.
Cognitive Appraisal Theory in Digital Contexts
Cognitive Appraisal Theory offers a way to understand how people perceive certain situations and how they respond (Lazarus, 1991; Lazarus & Folkman, 1984). The framework can be applied to e-commerce to gain insights into customer types. For example, new customers must build appraisals of an online business from the ground up without prior experience. They must use exploratory interactions and design cues to build evaluative frameworks in a cognitively demanding process that generates uncertainty. Repeat users, however, visit e-commerce businesses with pre-established appraisals formed through prior interactions, resulting in highly dissimilar psychological starting points in the customer journey. This idea is consistent with the perspective of Cognitive Appraisal Theory, which holds that the same behavior can reflect different psychological processes. A new user browsing through pages of an e-commerce business is likely exploring and learning about the goods offered by the business. For a returning visitor, however, spending the same amount of time browsing despite established knowledge may indicate difficulty making that decision, arising not from unfamiliarity or a lack of knowledge, but from a lack of understanding of the trade-offs involved in purchasing the product. This indecision creates a form of choice complexity similar to what is traditionally conceived in choice overload research (Chernev et al., 2015).
Bagozzi et al. (1999) distinguish between outcome-desire avoidance appraisals (i.e., negative outcome predictions) and outcome-desire pursuit appraisals (i.e., positive outcome predictions). For online shoppers, this framework suggests that new customers may feel apprehensive, expecting a negative outcome. Conversely, repeat customers with positive experiences may progress to outcome-desire appraisals, expecting successful transactions and feeling approach-oriented emotions. Each session may result in reappraisal, in which experiences that do not confirm negative expectations gradually shift customers from avoidance to an approach orientation.
Trust Barriers in Regulated Commerce
Categories with a wide range of purchase barriers present useful contexts for investigating customer behavior. There are several regulatory barriers that exist in alcohol e-retailing, such as age verification, state licensing, and retail compliance (Colbert et al., 2021), as well as consumer-facing obstacles such as perceptions of risk and the challenge of establishing trust in the absence of face-to-face interaction (Harridge-March & Quinton, 2005). Customers demonstrate self-regulation in purchases of socially sensitive categories according to high-consideration market research findings. In “strategic self-rationing,” Wertenbroch (1998) observes that consumers want to restrict access to desired products and self-regulate their behavior.
In online environments, these processes are realized over longer consideration time periods, across multiple shopping episodes, and with self-timed purchase decisions. Given these challenges, trust becomes central to online alcohol commerce.
Mayer et al. (1995) define trust as the “willingness to be vulnerable based on positive expectations of another party’s actions.” Furthermore, Mayer et al. (1995) maintain there are three core dimensions to trustworthiness: ability (i.e., competence to fulfill orders), benevolence (i.e., goodwill toward the customer beyond profit motives), and integrity (i.e., adherence to acceptable business principles).
Theoretical Mechanism for Compounding Effects
In addition to cognitive appraisal and trust building, which can explain evaluative processes during customer sessions, additional theory is needed to explain why session effects might amplify rather than progressively accumulate. We lean on habit-formation research to offer such an explanation. Wood and Neal (2009) define habits as automatic, habitual responses to particular circumstances (a particular place, sound, or preceding behavior) developed through the repetition of past experiences. They are often fast and powerful but difficult to modify. Crucially, “after people have repeatedly and consistently practiced using a particular behavior to accomplish a goal, other behaviors that served the same goal become less accessible in memory” (Wood & Neal, 2009).
Critically, Mayer et al. (1995, p. 722) propose that integrity may be most important early in a relationship, while perceptions of benevolence develop over time. When this concept is applied to how consumers shop online, integrity assessments happen in early sessions as shoppers are still familiarizing themselves (e.g., Is this vendor legitimate?). Later sessions, by contrast, as shoppers become familiar and more comfortable with the vendor, may be dominated by benevolence evaluation (e.g., Does this vendor care about my experience?). Importantly, Mayer et al. (1995) explain that customers who accumulate positive experiences without negative incidents can reinforce perceptions of trustworthiness through a feedback loop.
According to the behavioral momentum theory, which suggests that a higher rate of reinforcement makes a response more resistant to interruption, the strength of a behavior is similar to physical momentum or mass (Nevin et al., 1983). Online purchases might also build momentum that pulls customers back to their preferred sites, even in the face of attractive substitutes. The four processes outlined above (cognitive reappraisal, trust accrual, habit formation, and behavioral momentum) should reinforce one another, increasing the impact of each subsequent session.
Hypotheses Development
Because returning visitors bring a history of positive experiences that new visitors lack, their sessions should be more predictive of conversion. We formalize these expectations in the following hypotheses.
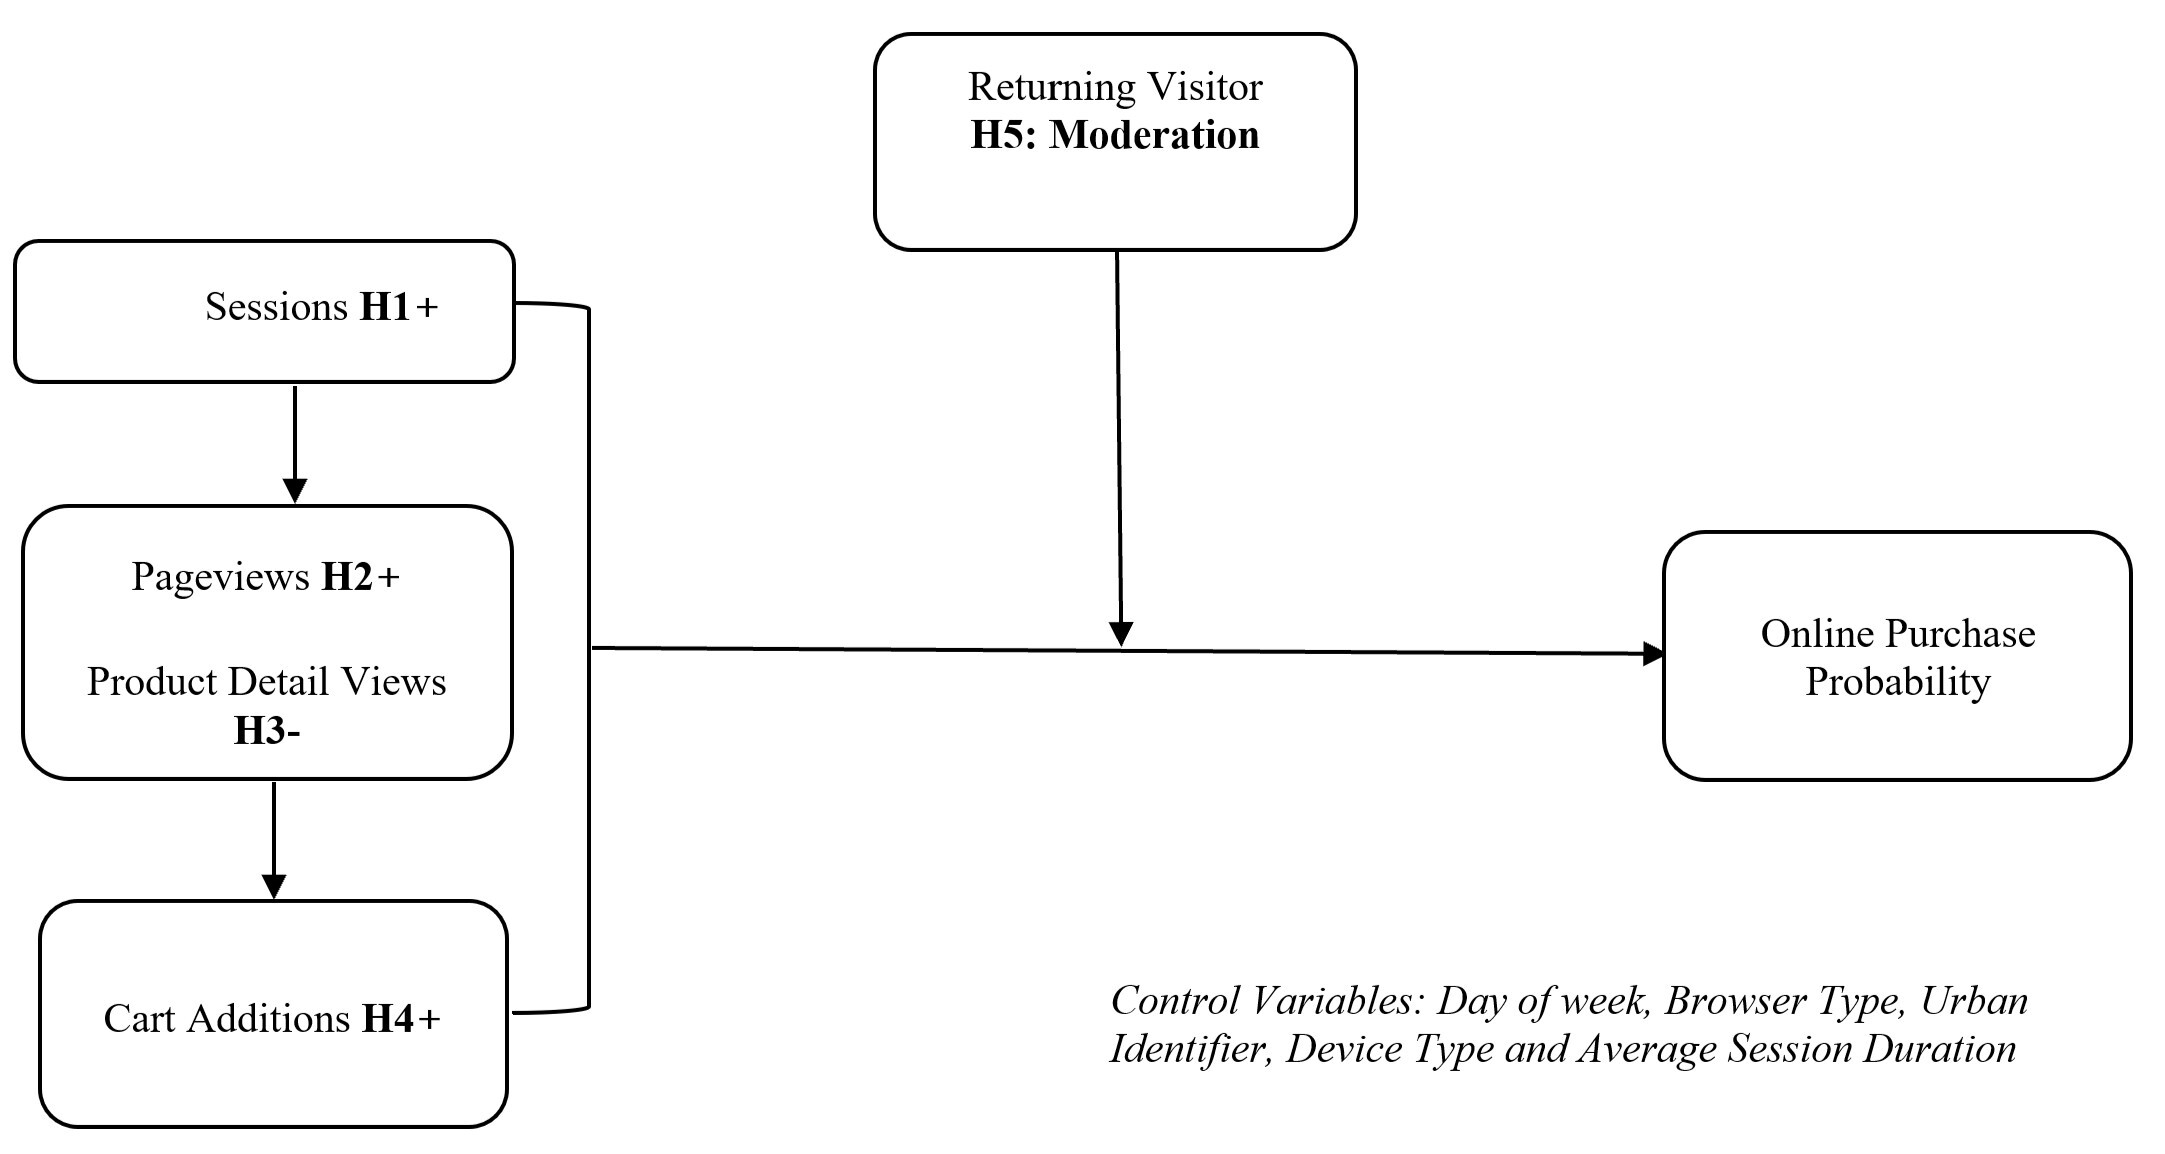
Dependent Variable: The probability of an online purchase is an intent to buy, which is determined by the likelihood that a customer will successfully make a purchase during the current session. It is a binary variable (0,1) and is the most direct measure of e-commerce purchase conversion and consumer choice (Bucklin & Sismeiro, 2003).
Purchase completion in high-consideration categories suggests that a successful path has developed through the cultivation of trust and product testing, leading to a commitment to buy.
Independent Variables: Web sessions are sequences of user activity separated by 30-minute inactivity intervals (Bucklin & Sismeiro, 2003; Montgomery et al., 2004) with initial sessions characterized by exploratory behaviors such as those Moe (2003) identifies as “knowledge-building” visits.
Traditional statistical models typically assume a linear relationship between the number of sessions and their marginal value. However, we suggest that the effect of the number of sessions compounds exponentially through psychological processes previously described. According to Cognitive Appraisal Theory, each session provides an opportunity for reappraisal, leading customers to adopt approach behaviors rather than avoidance (Bagozzi et al., 1999). Two other psychological processes likely underpin this reappraisal: the mere exposure effect, which leads to more positive evaluations of stimuli that are more familiar (Zajonc, 1968), and behavioral momentum, which produces greater resistance to change after positive outcomes have been experienced (Craig et al., 2014; Wood & Neal, 2009). For existing e-commerce customers, having prior trust shifts the focus from vendor validation to product evaluation (Kim et al., 2009). Therefore, we hypothesize:
H1: Session count is positively associated with purchase probability.
Pageviews measure engagement, but interpretation depends on user sophistication. First-time users face a large learning curve regarding site structure, product selection and availability, and navigation path; their higher pageview counts reflect the requisite learning behavior (Moe, 2003). For return visitors, however, high pageviews may indicate poor navigation or confusion instead of quality engagement. Information foraging theory would cause us to expect frequent users to establish good navigation patterns, in which they efficiently navigate to sought-after content (Pirolli & Card, 1999). If repeat users are over-browsing when they already know the site, this behavior suggests either navigation problems or unwillingness to purchase, rather than good exploration of the site. Therefore, we posit:
H2: Pageview count is positively associated with online purchase probability.
Product detail views indicate a transition from browsing to product evaluation. New users need thorough product information to evaluate the quality of and develop trust in new products. Repeat customers, having already developed trust and category knowledge, need a less detailed examination of products. Too many product detail views during repeat visits may indicate decision complexity instead of information seeking. Choice overload studies show that when customers are presented with too many options to compare, satisfaction decreases and decision-making delays (Chernev et al., 2015; Scheibehenne et al., 2010). In high-consideration product classes where trust is the major hurdle to purchasing, detailed product scrutiny by repeat users can indicate indecision or comparative analysis instead of productive consideration. Thus, we hypothesize:
H3: Product detail views are negatively associated with online purchase probability.
This hypothesis tests whether extensive product scrutiny functions as decision avoidance once trust barriers are resolved.
Cart additions are e-commerce metrics that are frequently repurposed to measure engagement (e.g., wish lists, price shopping, and product comparison; Close & Kukar-Kinney, 2010). Cart activity for high-consideration categories can indicate deliberation processes in which consumers are developing alternatives for purchase. Cart additions by new visitors can be an exploratory process, in which they are testing the capabilities of the site and exploring alternatives without any firm purchase intent. Repeat customers who are more frequent users of the site and have purchase intent also show more intentional cart behavior. Close & Kukar-Kinney (2010) found that cart additions of repeat customers signaled purchase readiness more clearly than exploratory intent. The experiential history of these users further increases the predictive ability of their cart behavior for actual purchase intent. Therefore, we hypothesize:
H4: Cart additions are positively associated with online purchase probability.
Moderator Variable: Returning user status reframes how all customer types interact with predictors of online purchase probability. New customers use sessions, pageviews, product details, and cart additions for learning and exploration, while building trust in the platform. Returning visitors, having already established trust and familiarity, use these same behaviors for purchase evaluation rather than vendor assessment. Therefore, the user type determines the interpretation of all engagement metrics: heavy browsing signals learning for new users but uncertainty for return users, whereas multiple sessions signal trust-building for new users but purchase consideration for return users (Moe & Fader, 2004). Thus, we hypothesize:
H5: Returning user status moderates the relationships between digital engagement behaviors (e.g., sessions, pageviews, product detail views, cart additions) and the probability of an online purchase.
Control Variables: Following prior e-commerce research, we controlled for device type (De Haan et al., 2018; Kukar-Kinney et al., 2022) and day of week (Sismeiro & Bucklin, 2004). Additionally, we controlled for browser type (Safari, Chrome, etc.), urban context (via IP geolocation), month (to account for seasonality), and session length. The controls isolate the effect of session accumulation on purchase likelihood.

Methods
Data and Measures
The research consisted of clickstream data from a US online alcohol retailer in 42 states (all US states except 8 require age verification and state-specific compliance systems to sell alcohol online). The data were recorded for an entire year (January–December 2022) using Google Analytics (GA4). The logs captured all user activity on the site, tracked by user ID (a unique, anonymous ID for each user). The overall dataset consisted of 126,335 unique visitors. Data on adding to cart were not available for 724 users (0.6% of users), making the data available for the regression models n = 125,611.
We identified the following variables. Purchase probability was the binary dependent variable (1 = purchased, 0 = not purchased). Our moderator classified users as new (0) or returning (1) based on GA4 cookie and user identifier tracking. Control variables were session length, device type (desktop as reference), browser type, day of week (Sunday as reference), and urban location (from IP geolocation).
Statistical Analysis
We employed logistic regression as appropriate for binary outcomes. Model 1 established baseline effects:
log(P(Purchase)/(1-P(Purchase))) = β₀ + β₁Sessions + β₂Pageviews + β₃ProductDetails + β₄CartAdditions + β₅Returning + γControls + ε
To test whether session effects differed by user type, we estimated separate models for new users (Model 2) and returning users (Model 3), excluding the user type indicator. Moderation effects were assessed by testing the equality of session coefficients across subgroups. Multicollinearity was assessed using variance inflation factors (VIF). All VIFs were below 3.92 (mean VIF = 2.24), which is well below the threshold of 10 that is considered an indicator of serious multicollinearity (Hair et al., 2019). All models used robust standard errors to account for possible heteroskedasticity. Stata 19 was utilized for this analysis.
Results
Descriptive Statistics and Hypothesis Testing
Table 2 presented descriptive statistics and compared purchasers and non-purchasers. Engagement differences intensified progressively across behavior metrics. For sessions, the ratio between purchasers and non-purchasers was 1.23, with purchasers averaging 1.93 sessions and non-purchasers averaging 1.57 sessions. For pageviews, the ratio between purchasers and non-purchasers was 4.08, with purchasers averaging 24.20 views and non-purchasers averaging 5.94 views. For product detail views, the ratio between purchasers and non-purchasers increased to 10.16, with purchasers averaging 21.35 views and non-purchasers averaging 2.10 views. Most dramatically, the ratio for cart additions was 8.29, with purchasers averaging 3.15 additions and non-purchasers averaging 0.38 additions, suggesting this behavior served as the strongest univariate predictor of purchasers.
Returning users comprised 22.1% of non-purchasers but 55.9% of purchasers. Mobile users dominated website traffic (63.8%) but were underrepresented among purchasers (56.9%).
Table 3 showed the logistic regression results. Model 1 estimated baseline associations for all users; Models 2 and 3 presented separate analyses for new and returning users to test moderation effects.
Supporting H1, sessions demonstrated the strongest association with purchasing, with each additional session increasing the odds of purchase by 22.2%, translating into nonlinear increases in predicted purchase probability (OR = 1.222, p < .001). The 22.2% increase per session substantially exceeded the marginal association of pageviews (1.0% per view) or product detail views (0.6% per view). This finding indicated that returning to the site was a greater predictor of purchasing than within-session browsing intensity. Five sessions were associated with an approximate 2.2-fold increase and six sessions were associated with an approximate 2.7-fold increase in predicted purchase probability. Returning user status was strongly associated with purchase (OR = 5.964, p < .001), or approximately 6-fold higher odds of purchase. This association was significant after controlling for all engagement variables. A test of coefficient equality confirmed that session effects did differ significantly between new and returning users (χ² = 10.72, p = .001), supporting H5. The positive difference indicated that the association between the number of sessions and purchasing was stronger for returning site visitors than new users. No other behavioral variable had a significantly differential association by user type.
The Compounding Pattern
Predicted probabilities of conversion for varying session counts revealed compounding patterns (Table 4). A new user with just one session had a purchase probability of just 0.73%. In contrast, the returning user with one session had a purchase probability of 4.17%. Purchase probability for new users increased from 0.73% (one session) to 1.95% (six sessions), a 2.69-fold multiplier. Purchase probability for returning users increased from 4.17% to 10.59%, a 2.54-fold multiplier. Both multipliers were very close and exhibited compounding, but returning users had substantially higher absolute conversion at each phase of every session. The non-overlapping 95% confidence intervals indicated that the differences were statistically significant.
Marginal gains in predicted probability increased with each additional session. For returning users, moving from one to two sessions increased conversion probability by 0.88 percentage points. Moving from five to six sessions increased the conversion probability by 1.75 percentage points, about twice as large despite representing the same one-session increment. This pattern contradicts diminishing returns, suggesting sessions compound upon prior engagement.
User Type Differences
New users had a 1.76% baseline conversion rate with a 17.9% increase in odds per session (OR = 1.179). Repeat users had a 7.41% baseline conversion rate with an increase of 29.4% (OR = 1.294). The difference in session effects between groups was significant (χ² = 10.72, p = .001). Seasonality was jointly significant (χ² = 746.59, p < .001), with conversion highest in November–December, yet session effects remained robust after accounting for monthly variation.
Supporting H2, pageviews were positively associated with purchase (β = 0.008, p < .001). H3 was not supported. We predicted that product detail views would be negatively associated with purchase, but the relationship was positive (β = 0.006, p < .001). In high-trust situations, product information processing seemed to be an affirming rather than an avoidance activity. Product concerns were alleviated once vendor legitimacy was determined, and product examination could have solidified commitment to the purchase.
Results indicated that product detail page views were more strongly associated with purchase among returning visitors (1.4% increase in odds per view, p < .001) than new users (0.4% increase, not significant). Table 5 indicated that returning visitors exhibited 4.22-fold higher conversion rates than new users but only 1.18-fold higher average order value ($295.49 vs. $249.70). Expected value per visitor was $21.90 for returning visitors vs. $4.38 for new users. That 5.00-fold difference, a 400% increase, comes from variation in conversion rate, not transaction size.
Discussion
Theoretical Implications
The compounding pattern can be explained by four theoretical pillars, each addressing a different aspect. First, the compounding pattern in our data, where each visit contributes more than the previous one, is what Habit Formation Theory (Wood & Neal, 2009) would predict. As the number of sessions accrues, consumers drop alternatives from their consideration. Consequently, later sessions are more strongly associated with purchasing. Second, while Habit Formation Theory explains the change in consumers’ behavior, Cognitive Appraisal Theory explains the modification of their product evaluations. At baseline, purchasing strongly favored returners because site users transitioned from avoidance mode (risk scanning) to approach mode (product choice) (Bagozzi et al., 1999). For example, customers start their purchase journey in avoidance mode (e.g., “Is this website safe?”), and as trust builds, they shift to approach mode (e.g., “Which product fits my needs?”). Trust in a site builds gradually and grows stronger as customers provide feedback about their purchasing experiences.
Third, Mayer et al.'s (1995) trust-building theory describes the feedback loop in which positive sessions prime the following ones, and customers return to the site because of their positive experiences. Consumer trust forms in early sessions, then deepens with each return, creating the compounding effect we observed in this study.
Fourth, once consumer habits are formed and they have established trust in a site, we see an increased gap in the session effect between returners and new customers, which fits behavioral momentum theory (Craig et al., 2014; Nevin et al., 1983). Once returning customers settle into a purchasing pattern, competitors struggle to disrupt it. The moderating effect of user type is strongest at the session level, not at the page-view, product-view, or cart-addition levels. Customers cross the trust threshold before navigating to the site, not while they are browsing. For online retailers, this matters; the return decision is what signals trust.
Practical Implications
Across 126,335 verified customers of an SME e-commerce platform, we find that web sessions are associated with purchase probabilities exhibiting accelerated rather than linear growth. Customers who returned to the website were approximately 5 times as likely to purchase as new customers. In an industry with a continued focus on acquisition strategies (Optimove, 2023; Weinstein, 2002), a fivefold difference will be challenging to reconcile. We discuss the implications below.
First, our analysis shows that visit frequency is more valuable than higher conversion rates at the same session level. Each return visit increases the odds of purchase, making repeat-traffic strategies more valuable than push-to-buy-now approaches. Cart abandonment emails (e.g., emails sent to customers who added items to their shopping cart but didn’t complete the purchase), retargeting campaigns (e.g., ads shown to previous visitors and browsers), and early loyalty enrollment are low-cost tactics that bring customers back for additional sessions. For example, a cart abandonment email sent within 24 hours of leaving items in a cart without completing the purchase can prompt a return visit. The same can be true for small incentives, such as free shipping or coupon codes, which give customers a reason to return even if they do not purchase immediately. Such incentives can be particularly effective for new customers.
Second, converting a new user to a returning user may be a high-value strategy for practitioners. The results indicate that a customer’s baseline purchase probability may be expected to increase after their first visit, although the magnitude will vary by category and specialty. Given the considerable purchase likelihood advantage for returning customers and the frequency premium, SMEs should prioritize converting first-time visitors into returning customers even if it means accepting lower margins on initial purchases. Once a customer becomes a returning visitor, that is when the behavior really changes, so crossing that initial threshold is key. It’s a way for small businesses to compete when they can’t necessarily match big box retailers on acquisition budgets.
Third, mobile devices are often used as discovery tools. Although conversion rates are lower on mobile devices, mobile sessions build familiarity and trust before customers use desktop to complete their purchase (Han et al., 2022). Mobile design should reflect that session effects often compound across multiple devices before a purchase occurs. Retailers gain more from mobile experiences that encourage return visits than from aggressive checkout funnels. E-commerce websites such as Shopify that offer wish list apps and allow mobile users to bookmark pages for later views are building not just visit frequency but familiarity. Rather than optimizing “buy now” buttons on mobile devices, retailers can prioritize image galleries and customer reviews that support the discover phase of the purchase journey.
Fourth, purchase frequency is a stronger predictor of value than order size. SMEs need to reallocate resources from upsell efforts into repurchase facilitations. Rather than trying to convince customers to increase order value, online retailers should determine how repeat buyers want to fulfill their repeat needs and work to make the return process faster and easier. An online merchant can send e-mails to customers notifying them when products are back in stock and provide one-click order forms specific to that customer. The fewer clicks necessary for a purchase, the higher the conversion rate for returning customers, who have already been shown more likely to convert. Thus, rather than calculating a user’s average order value, SMEs should consider tracking purchases per customer per year and tailoring email messaging, loyalty, and sale calendars accordingly.
Limitations and Future Research
Our research presents a number of limitations. First, our study only used data from a single online retailer and findings may not apply to all e-commerce. Other digital retailers may have different products or services, website interface design, and user behaviors, which need a different approach to increase repeat visits. Second, since this is an observational study, we can only show associations, but not causality. Repeat visitors may have an unmeasured characteristic that is not captured by our controls and affects both repeat visits and purchase behavior. Third, the one-year observation window may miss longer-term behavioral patterns. Fourth, analyzing a single high-consideration category means we do not know whether the 22.2% compounding rate of repeat visitors is category-specific or generalizable. Future work can conduct A/B tests to examine the drivers of session frequency and test psychological mediators of the likelihood to purchase. Research should use a direct measure of trust, familiarity, and anxiety reduction as customers become more accustomed to digital platforms in these sensitive categories. In addition, future studies can explore if the rate of compounding on purchase differs for high-consideration categories or if it is a more general phenomenon signaling the accumulation of trust.
Fifth, although this research was guided by well-known theories of the construct of trust, we did not directly test it using surveys, scales, or experiments designed to exclusively measure participants’ level of trust or their cognitive appraisals of trust. Our findings are, however, consistent with the predictions of these theories. Future research could include survey measures of perceived trust, familiarity, or purchase confidence to validate these theoretical connections.
Conclusion
Our analysis of 126,335 verified customers of an SME e-commerce platform reveals that web sessions are associated with purchase probabilities, with accelerated rather than linear growth. Retailers not segmenting their customers and falling back on old ‘one-size-fits-all’ tactics may be missing out on the revenue potential that repeat visits could generate. Our findings show that the value premium for returning visitors was driven by purchase frequency, which was over 4 times higher than for new visitors, rather than by order value, which was less than 20% higher. This suggests that businesses, especially those in high-consideration categories, should place immense value on retention, which generates most of the revenue.
Corresponding Author:
Jumana (Jay) Black, Ph.D.
Texas A&M University-Texarkana
7101 University Avenue
Texarkana, TX 75503
Funding
This research did not receive any specific grant from any funding agency in the public, commercial, or not-for-profit sectors.
Declaration of competing interests
The authors declare that they have no known competing financial interests or personal relationships that could have appeared to influence the work reported in this paper.
Data Availability
The data that support the findings of this study are available from the corresponding author upon reasonable request.