


1. Introduction
The literature has recognised and studied individually (or in very isolated small groups) more than a dozen factors associated with financing that influence the development of innovation. In addition to typical factors such as risk, the interest rate available and collateral, there are other determinants of innovation such as theoretical elements associated with informational inefficiencies, the cost of capital, asymmetric information and moral hazard, taxes and subsidies, the capital structure, spillovers, and transaction, bankruptcy and adjustment costs.
In addition to some empirical studies, there are also partial theoretical models that inform the field of innovation financing: models such as the Capital Asset Pricing Model [CAPM] (Lintner, 1965; Mossin, 1966; Sharpe, 1964; Treynor, 1961) and the Arbitrage Pricing Theory [APT] (Ross, 1976) or capital structure models such as the theorem of Modigliani and Miller (1958), pecking order theory (Myers, 1984), trade-off theory (based on Modigliani & Miller, 1963), and the theory of the ranking of the cost of capital of Auerbach (1984). However, these models are still very fragmentary and were not explicitly designed for describing innovation financing per se and focus, ceteris paribus, on a single theoretical element at a time (or on a few of them) (Padilla-Ospina et al., 2018).
In this context, with dozens of factors associated with financing that impact innovation, and amid a shortage of studies focused on emerging markets (Leiponen & Poczter, 2014) and SMEs, the following question captured our attention: What are the most important variables associated with financing for developing innovation in the SMEs of an emerging market such as Colombia? The answer to this question addresses the empirical gap that this research aims to fill. To date, an academic study on this research question has not been conducted, especially one on a large scale like we target.
Our study includes a comprehensive spectrum of variables associated with financing covering practically every theoretical element of innovation financing. State-of-the-art predictive analysis methods are used to accurately establish the key factors associated with financing that most influence the presence of innovation in SMEs. This study pioneers the effective use of these predictive methods.
To address this research, we analysed the SMEs of Colombia within the manufacturing and services sectors, considering both process and product innovations (OECD/Eurostat, 2018). The last few years have shown relative progress in science, technology and innovation policy in Colombia (Gómez & Mitchell, 2014; Orozco et al., 2013, p. 743). However, despite this relative progress, in a multitude of indicators, Colombia still does not fare well in terms of innovation, the evidence of which is Colombia’s low levels of innovation. Colombia’s positions in the rankings of The Global Innovation Index (position 63; Dutta et al., 2016) and in The Global Competitiveness Report (position 77 in the innovation pillar; Schwab, 2017) categorise the country as an inefficient innovative country with low R&D spending (Gómez & Mitchell, 2014). To summarise the situation, the ‘Colombian innovation system is still small and lacks a strong business center’, and ‘its performance is well below the level required for its sustained development’ (OECD, 2014). As such, Colombia may be considered a paradigmatic nation in which, due to its emerging market nature, financing for innovation plays a fundamental role in determining innovation.
The remainder of this paper is structured as follows: Section 2 presents a review of the theoretical and empirical background on financing innovation. Section 3 describes the empirical approach to address the research and includes the data description, the empirical model, the estimation strategy, and the summary statistics. Section 4 presents the results. Section 5 discusses the findings in a broader context. Section 6 concludes by highlighting the implications of our findings and a possible future line of research.
2. Related literature
Our main interest is to identify the most relevant financial variables in the development of (product and process) innovation activities in SMEs in an emerging country such as Colombia. We found that most studies in the field of innovation financing focus on the topics of capital structure (Bartoloni, 2013; Boyer & Blazy, 2014; Egger & Keuschnigg, 2015), use of (external/internal) sources of financing (Ayranci & Ayranci, 2016; Kerr & Nanda, 2015; Leiponen & Poczter, 2014; Poczter & Leiponen, 2016; Serrasqueiro et al., 2016), the availability of funding sources (Hall et al., 2016; Kaufmann & Tödtling, 2002), and restrictions on obtaining financing for innovation (Brancati, 2015; Canepa & Stoneman, 2008). Additionally, different models and theories such as agency cost theory (Jensen & Meckling, 1976), moral hazard theory (Holmstrom, 1989), the cost of capital (Mossin, 1966; Sharpe, 1964; Treynor, 1961), and different capital structure models (Berger & Udell, 1998; Modigliani & Miller, 1958; Myers & Majluf, 1984) have sought to inform the field of financing innovation.
The present study is the first of its kind that analyses the largest number of financial variables to identify their importance in the development of innovation activities in Colombian SMEs using advanced prediction analysis methods. At the end of the study, we used 19 variables associated with finance, grouped into 11 features, and 5 additional control variables. The data generated make it possible to modify or create new policy instruments for SMEs that wish to innovate, as well as to provide guidance for SME entrepreneurs who intend to innovate in the short or medium term.
Several studies have mentioned some of the financial variables that we include as factors that may affect the financing of innovation activities. For example, managers’ risk aversion (Kapteyn & Teppa, 2011), moral hazard and agency costs (Hall & Lerner, 2010), the expected cost of bankruptcy (Acharya & Subramanian, 2009; Higgins, 2012), adjustment costs (Bernstein & Mohnen, 1998; Himmelberg & Petersen, 1994), information asymmetry (Canepa & Stoneman, 2003; Hall & Lerner, 2010) and the cost of capital (Baldwin & Lin, 2002; Bunduchi & Smart, 2010).
One of the main articles that has considered several financial variables simultaneously has been the article by Hall and Lerner (2010). They argue that companies that develop R&D and innovation have problems of information asymmetry, moral hazard, capital structure, taxes and sources of financing. With the study of the theory, a survey of the literature and an empirical estimate, Hall and Lerner (2010) conclude that small and start-up companies in R&D-intensive industries have high capital costs that can be reduced with venture capital. The evidence related to the cost of capital also suggests that this indicator can negatively influence the development of product and process innovation activities in companies (Baldwin & Lin, 2002; Bunduchi & Smart, 2010).
Among the other costs that can influence the development of innovation activities in companies, adjustment costs stand out. Some studies suggest that adjustment costs are higher for companies that develop innovation activities (Bernstein & Mohnen, 1998; Himmelberg & Petersen, 1994). Finally, regarding the expected cost of bankruptcy, there are studies that suggest that it can have a positive effect on the development of innovation activities, given that the more indebted an innovative company is, the more it will try to intensify its activities to avoid entering bankruptcy (Acharya & Subramanian, 2009; Aghion et al., 2002).
Our study also includes characteristics of credit, such as guarantees and collateral. Studies suggest that innovative SMEs do not have solid collateral for obtaining a loan (Hottenrott & Peters, 2012; Takalo & Tanayama, 2010), and it has even been affirmed that there is no significant effect between collateral and the development of innovation activities (Savignac, 2008). This work also addresses the characteristics of companies accessing credit. There is evidence to suggest that due to the risk profile demanded by banks after the 2008 crisis, loans to potentially innovative SMEs have been drastically restricted (Hall et al., 2016; N. Lee et al., 2015; Lussuamo & Serrasqueiro, 2020).
The risk aversion of managers is another characteristic that was included as a predictor of the development of innovation activities in companies. The results regarding this variable suggest that the greater the risk aversion is, the greater the tendency to reduce innovation activities in companies (Ahluwalia et al., 2017; Aiello et al., 2019; Mahto et al., 2018; Tsur et al., 1990).
The difficulty, preference, and term of funding sources, which have close relationships with the capital structure, were also included in our study. In this context, the evidence does not show a consensus. Some studies conclude that innovative companies prefer to finance themselves with internal funds (Ayranci & Ayranci, 2016; Serrasqueiro et al., 2016) while other studies consider that companies prefer bank loans (Hsu et al., 2014; Leiponen & Poczter, 2014; Poczter & Leiponen, 2016). Other authors conclude that companies prefer to issue shares (Brown et al., 2013; Kim & Weisbach, 2008). Regarding the term of funding sources, there is evidence to suggest that companies that have greater long-term debt are less likely to develop innovation activities (Baldwin et al., 2002; Yigitcanlar et al., 2018). It should be clarified that the results obtained depend largely on the countries that have been studied.
Additionally, the company size and company age are important control variables in innovation financing. In general, smaller and younger businesses tend to have greater financial constraints (Beck et al., 2002). Crepon et al. (1998) find a significant positive effect between size and the likelihood of innovation. Company age is another important factor in innovation financing because, in addition to being correlated with size, young companies have not forged solid relationships with banks, which exacerbates information asymmetry problems (Barwinski et al., 2020; Berger & Udell, 2002; Petersen & Rajan, 1995); and because young companies do not have previous projects with which to finance new projects, among other reasons.
The works existing in the Colombian context are closely related to the capital structure of Colombian innovative companies. In this context, there is a consensus among experts that suggests that Colombian companies that develop innovation activities prefer using internal funds (Barona-Zuluaga et al., 2015; Sierra et al., 2009). In fact, it has been observed that the preferences for financing sources of Colombian innovative companies are internal resources first, bank financing second, and supplier credit finally (Barona-Zuluaga et al., 2015; Barona-Zuluaga & Rivera-Godoy, 2017; Padilla-Ospina et al., 2015; Rivera-Godoy, 2015). These preferences are partly consistent with the predictions of pecking order theory (Myers & Majluf, 1984). However, financial factors unrelated to capital structure that affect the development of innovation activities have not been thoroughly studied, as in our work; hence, our work offers a general academic result and provides new, specific empirical evidence on Colombian SMEs.
3. Empirical approach
3.1. Sample and datasets
As in any supervised learning problem, we used a training dataset to build and validate the prediction model and a testing dataset to test this trained model and demonstrate its generalizability. The sampled population consisted of 5,450 Colombian SMEs from the industry and services sectors during 2016. Of the total number of companies surveyed, 157 completed full questionnaires (the training dataset). The questionnaire extension and complexity and the requirement that only the general manager, higher-level managers or the general accountant could respond may explain why the response rate was relatively low. The training dataset included innovative and noninnovative companies using stratified sampling. A balanced proportion of 61.78% of innovative companies to noninnovative companies was maintained during the data collection. The sample stratification was based on the largest sector (industry and services), size (medium and small) and main city. This particular stratification was chosen so that the training sample would be more representative of the population (given the small sample size) in terms of enterprise sector, origin and size than a survey based on simple random sampling. Furthermore, while small and medium companies do not necessarily behave equally, they were proportionately represented in the sample so that the predictive model was built on representative data. As an additional failsafe, size by number of employees and major sector were used as input control variables in the model. This original sample served as the training and validation datasets in the construction of the predictive models for the presence of innovation.
Additionally, 82 questionnaires were collected by convenience sampling and were used as the testing dataset. These questionnaires were collected by recontacting the 5,293 (= 5,450 − 157) enterprises via email and offering a free personalised financial analysis to respondents. The flexible ‘real-life’ choice of the testing dataset raised the hurdle of generalizability that the final model should have acquired, but the robust stratified sampling and the rigorous modelling process ended in a satisfactory predictive model according to standard measures (Table 2). All the results reported in this paper are out-of-sample—that is, the results are based on the testing dataset, not on the training dataset used to build the model.
Following recent literature (cf. OECD/Eurostat, 2018), we studied the two types of innovation: process and product. To establish the size of the companies, we used Article 2 of Law 905 (Ley 905, 2004), ‘which modifies Law 590 of 2000 on the promotion of the development of micro, small and medium-sized Colombian enterprises and other provisions are dictated’, where micro, small or medium companies are defined according to the value of their assets.[1] Correspondingly, small enterprises were defined as those having annual assets between 500 and 5,000 Colombian legal monthly 2016 minimum wages, and medium enterprises were defined as those having assets between 5,000 and 50,000 Colombian legal monthly 2016 minimum wages (Banco de la República de Colombia, 2017).
3.2. Empirical model and estimation strategy
To determine the most important variables associated with financing for developing innovation, we began by building a binary dependent variable model to predict whether an SME innovates. These models are typically labelled classification models in the machine learning literature. Subsequently, we used a model-agnostic measure of variable importance based on the idea that a given variable A is more important than a given variable B when removing the effect of variable A in the model deteriorates the model’s performance further than removing the effect of variable B.
To construct the base model, we used logistic regressions, support vector machines, neural networks, random forests, and gradient boosting machines (Kuhn & Johnson, 2013; Titterington, 2010). Bayesian optimisation was considered to establish the methods that offered a better prediction, resulting in the selection of the neural network method.
Once the neural network method was selected, its hyperparameters were optimised via Bayesian optimisation. This method selects the number of connections (also called ‘parameters’), the activation function (logistics, ramp or hyperbolic tangent) and the type of network (convolutional or feedforward). Thus, an exploration of several sets of neighbouring hyperparameters was performed to achieve a set of best models of the selected type. Finally, these preoptimal models were combined, following the evidence that a combination of prediction models usually surpasses the best individual models.
The importance of the variables was calculated as the deterioration in a criterion of excellence or adequacy of the model when the effect of a particular variable in the classification model was neutralised. In other words, a variable is more significant if there is a substantial deterioration of the classification adequacy of the model after ‘neutralising’ the variable. Neutralise is the elimination of the effect of the variable on the model. The deterioration in the performance of the model due to neutralising a given variable, then, suggests that the variable is significant either for the correct functioning of the model or to maintain the model’s optimal performance. Thus, it is sufficient to choose the criterion of excellence or adequacy to estimate the deterioration of the model and compute the importance of a variable. Accuracy was chosen as the adequacy measure, and the recommendation of Breiman et al. (1984) to randomise the value of the variable whose importance is calculated with realistic values was adopted. Therefore, the values of the variable in the whole test set were permuted between the companies (leaving the values of the other variables unchanged) to neutralise that variable. This process was repeated several times so that the final result was not arbitrary and did not depend on a particular permutation, but instead depended on the effect of the importance of the variable in multiple permutations. In this way, it was possible to calculate both the importance of the variable and the distribution of the variable’s importance due to successive randomisations. When calculating the importance of each variable, the randomisation was repeated fifty times for each model.
3.3. Summary statistics
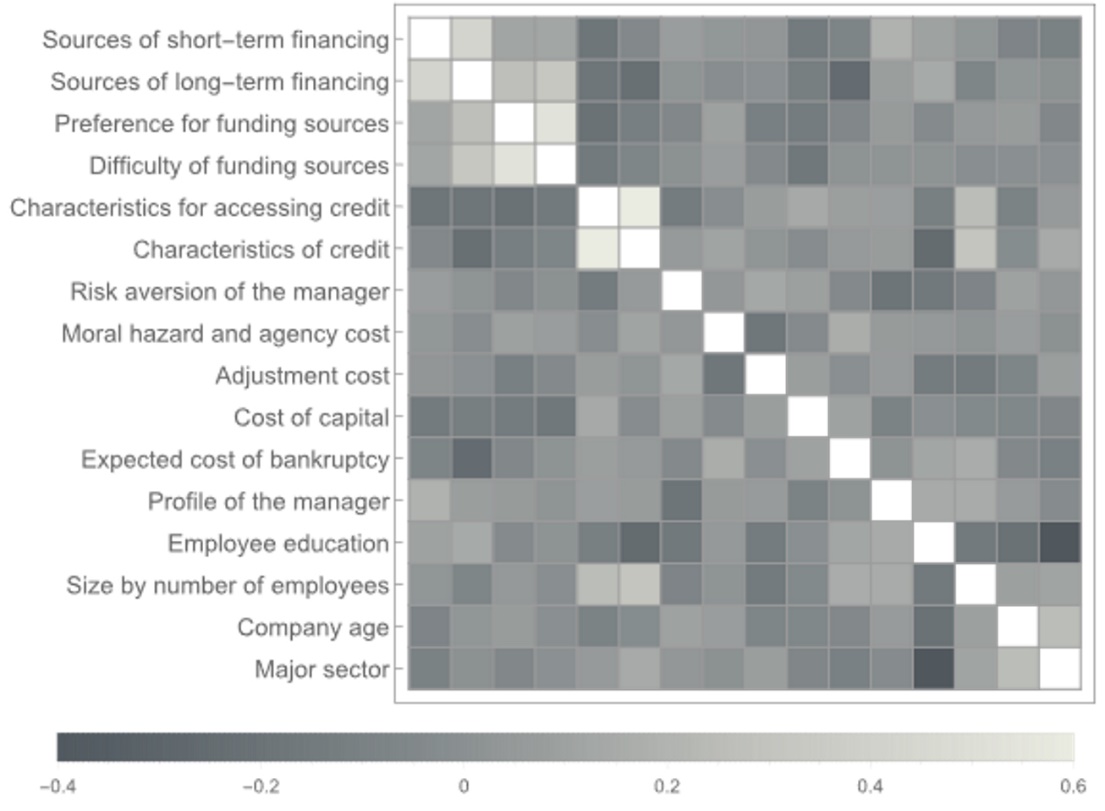
The Online Appendix[2] describes the definition and final operationalisation of the different variables or features (Table A1), as well as the feature engineering process. Figure 1 illustrates the correlogram of the variables used in the prediction model of the presence of innovation. The correlogram shows that no collinearity exists among the independent variables of the model. In effect, the correlations between the independent variables oscillated between a minimum of –0.42 (‘employee education’ versus ‘major sector’) and a maximum of 0.61 (‘characteristics for accessing credit’ versus ‘characteristics of credit’).
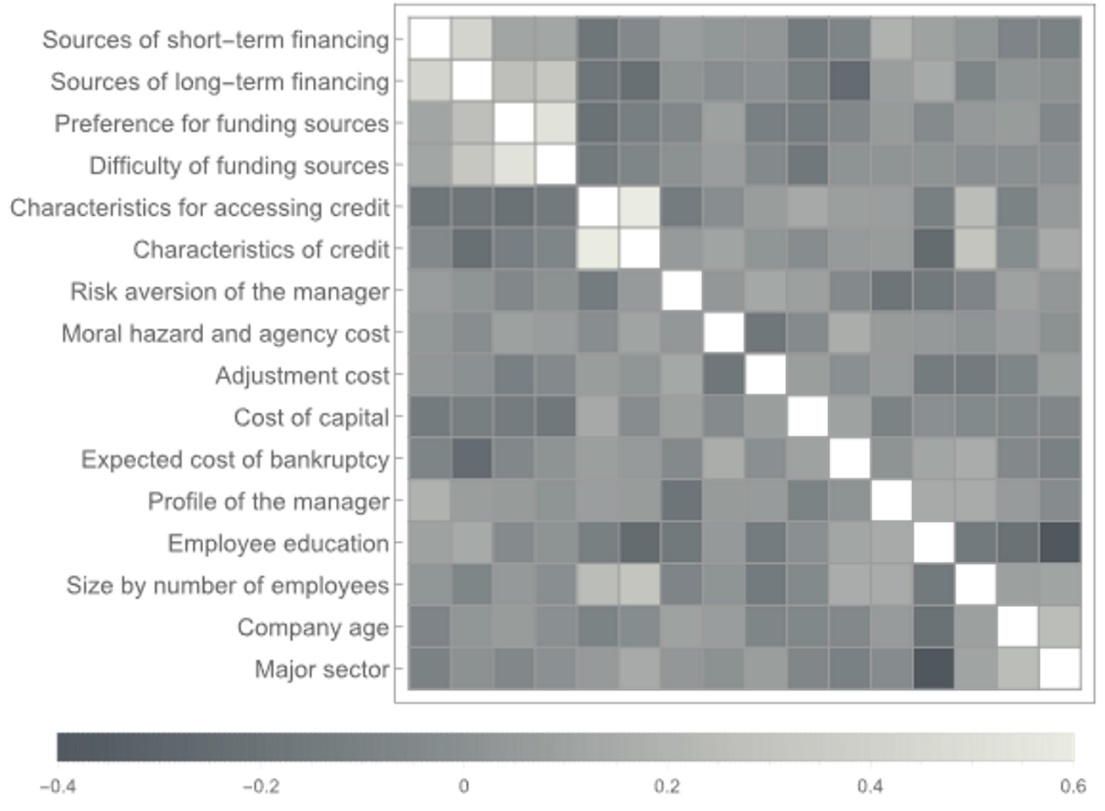
Table 1 presents the basic summary statistics (mean, standard deviation, skewness and excess kurtosis) of the variables. By definition, all variables are in the range [–0.5, 0.5]. After computing the corresponding t-test, only the variable ‘characteristics for accessing credit’ has a nonzero mean (with five percent significance). This variable also has the largest absolute values of its skewness and excess kurtosis. The corresponding values denote a negative skew and a leptokurtic distribution.
Regarding each of the sixteen variables, nine are negatively skewed, and seven are positively skewed. However, only the ‘expected cost of bankruptcy’ is substantially (negatively) skewed, denoting a longer left tail of expected cost values.
Furthermore, three variables are platykurtic, one is mesokurtic, and twelve are leptokurtic. However, only four variables are substantially leptokurtic (‘characteristics for accessing credit’, ‘sources of short-term financing’, ‘employee education’, and ‘company age’), and only one is substantially platykurtic (‘major sector’). According to the standard interpretation of excess kurtosis, the leptokurtic variables exhibit ‘fatter tails’ while the platykurtic variable exhibits ‘thinner tails’.
4. Results
Because the neural networks achieved models with greater accuracy and area under the ROC curve, Bayesian optimization was later used for the hyperparameters of only these models. In this way, after preliminary experiments, a grid search was performed on the number of parameters (or neural connections), going from a 90-parameter neural network to a 130-parameter neural network, in intervals of five parameters, to select the characteristics of the best neural network. That is, for a number of established parameters, Bayesian optimization of the other hyperparameters was performed in each case. The maximum number of training rounds was 40,000 for each model, and the models were trained on graphics processing units (GPUs).
Table 2 shows the summary of the adjustment measures of the nine neural network models that predict the presence of innovation. In Table 2, the best neural network models can be identified based on the results achieved by the adequacy measures: the accuracy, area under the receiver operating characteristic (ROC) curve, Cohen’s kappa coefficient, Youden’s J statistic, precision (PPV), NPV, recall (TPR), and specificity (TNR).[3]
According to the values obtained, the best neural networks that predict innovation have 110, 120 and 125 parameters (Table 2). The three models obtained high accuracies (0.76 for the 110-parameter model and 0.67 for the 120- and 125-parameter models), which suggests that these three models are very close to predicting the presence of innovation. It should be noted, however, that 78% of the companies in the test set innovate, so the accuracy achieved does not exceed the accuracy of the naive model in which all companies innovate. However, the behaviour of these models in terms of the area under the ROC curve is reasonable: the model with 110 parameters obtained a value of 0.64 while the models with 120 and 125 parameters had a value of 0.70. Although this value should be close to one, which would suggest that the model has perfect accuracy in predicting the presence of innovation, a value of 0.7 is considered acceptable in the literature (Mandrekar, 2010).
In addition, Cohen’s kappa coefficient computes the adjustment of the prediction considering the imbalance of the sample between innovative and noninnovative firms. For the 110-parameter model, Cohen’s kappa coefficient was 0.32; while for the 120- and 125-parameters models, it was 0.24, suggesting that the models have a slight prediction adjustment despite the sample being unbalanced (C. Lee et al., 2018). Finally, it is expected that Youden’s J statistic should be close to 1, which would indicate that the model is satisfactorily classifying the companies that innovate and those that do not innovate. The model with 110 parameters has a Youden’s J statistic of 0.33, and the models with 120 and 125 parameters obtained a value of 0.30, which again suggests models with a slight adjustment despite the sample being unbalanced. This means that the models are somewhat robust to the presence of more innovative than noninnovative firms in the sample.
The worst prediction models of innovation are the 90- and 115-parameter models due to the accuracy (0.63 and 0.56, respectively), area under the ROC curve (0.63 and 0.53), Cohen’s kappa coefficient (0.08 and 0.03, respectively) and Youden’s J statistic (0.09 and 0.04, respectively) values obtained (Table 2). Nevertheless, these models achieve a reasonable area under the ROC curve greater than 0.5, the standard value of nondiscrimination for models that only randomly guess between companies that innovate and do not innovate.
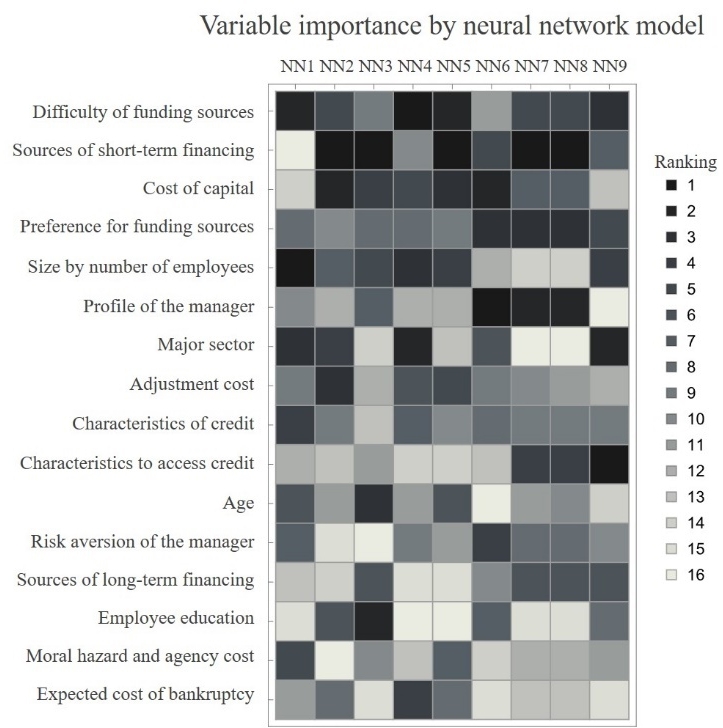
Figure 2 illustrates the relative rankings of the variables for each model after ordering them according to their average ranking among the nine models. Figure 2 indicates that the most important variables according to the average ranking of the models are ‘difficulty of funding sources’, ‘sources of short-term financing’, ‘cost of capital’, ‘preference for funding resources’, ‘size by number of employees’, ‘profile of the manager’, ‘major sector’, ‘cost of adjustment’, ‘characteristics of credit’ and ‘characteristics for accessing credit’. The minor variables in the models proved to be ‘expected cost of bankruptcy’, ‘moral hazard and agency costs’ and ‘employee education’.
From the nine preoptimal models formed, the forecasts were then combined to determine if the performance of a combined model could surpass the performances of all individual models. Indeed, this did occur, and the ROC curve and the measures of adequacy of this combined model are shown in Figure 3.
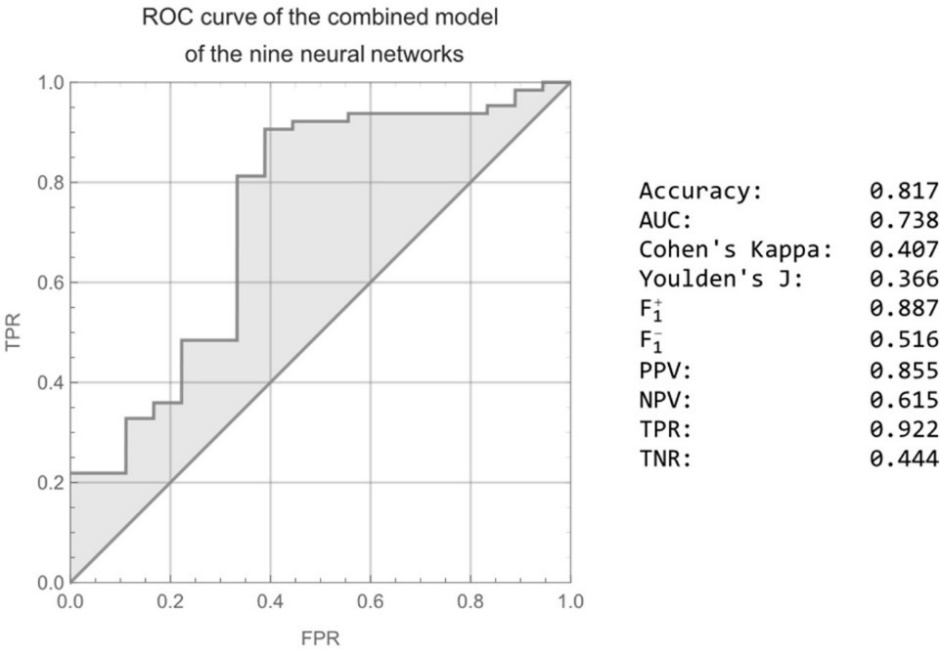
The adequacy measures of the combined model were generally greater than those of the individual models. The accuracy achieved of 0.817 is above the value that would be obtained with a naive model in which all companies innovate (78% of them do innovate). The area under the ROC curve of 0.738 of the combined model is acceptable according to the literature (Mandrekar, 2010) and is higher than that of any of the individual models. Furthermore, the (positive score), (negative score), PPV, NPV, TPR and TNR are acceptable (greater than 0.40). These measures show that the combined model is more effective at detecting innovative companies than noninnovative companies is much greater than the PPV is much greater than the NPV, the TPR is much greater than the TNR, and the PPV and TPR are approximately 0.9).
The Cohen’s kappa of 0.407—which considers the prediction adjustment, taking into account the imbalance of the sample between innovative and noninnovative firms (C. Lee et al., 2018)—shows a slight adjustment higher than the maximum slight adjustment achieved by the individual models. Furthermore, Youden’s J statistic has robust behaviour similar to that of some of the best individual models.
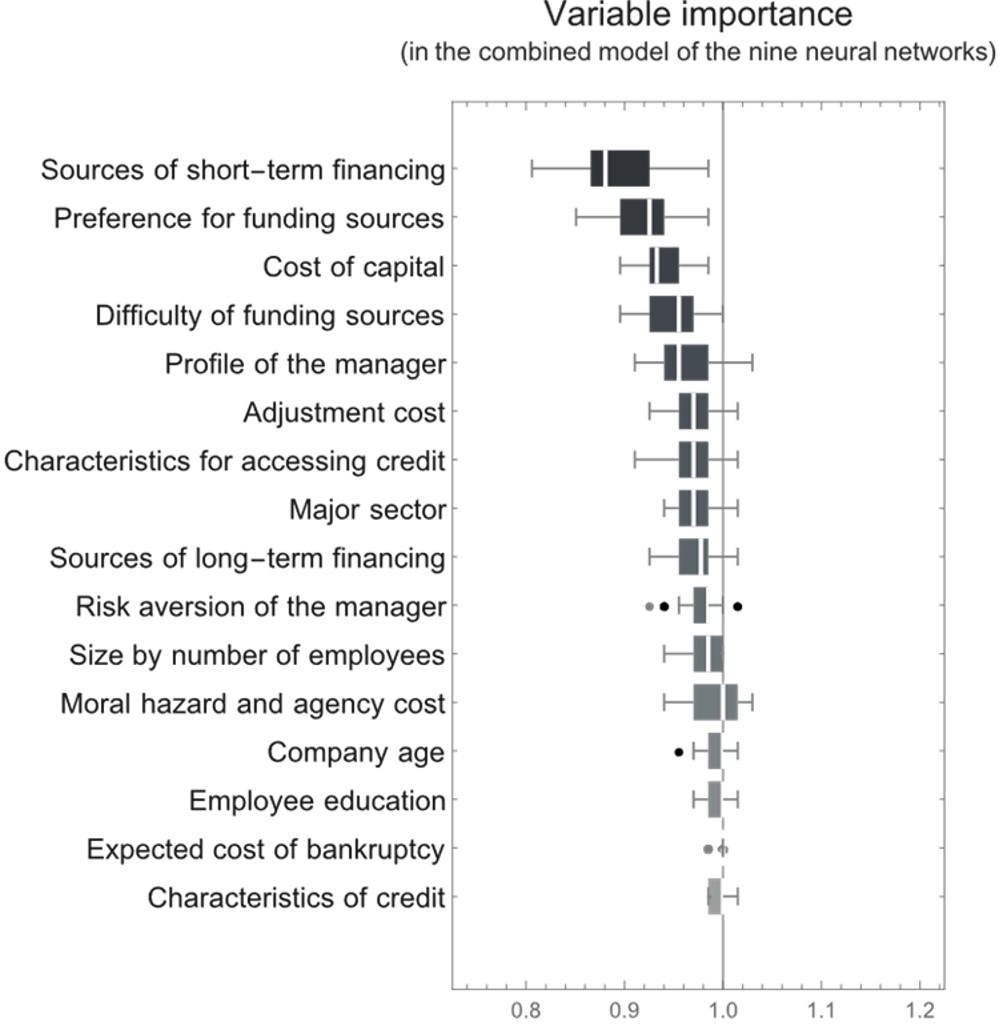
Figure 4 illustrates the importance of the variables in the combined model. All variables are essential in the final model according to the criterion of showing a value of importance less than one for the variable. According to this model, the ten most essential variables for the presence of innovation in Colombian SMEs are ‘sources of short-term financing’, ‘difficulty of sources of financing’, ‘cost of capital’, ‘preference for funding sources’, ‘major sector’, ‘employee education’, ‘adjustment cost’, ‘profile of the manager’, ‘age’ and ‘sources of long-term financing’. The variables with less importance are ‘characteristics of credit’, ‘risk aversion of the manager’ and ‘characteristics for accessing credit’.

A strong coincidence exists in terms of the differences among the positions of each variable in each ranking (Figures 2 and 4): the first hierarchy extracted from the average rank of the variables in the nine neural network models and the second hierarchy based on the combined model that uses these nine neural networks. This observation shows the coherence in the results obtained by two different methods that approximately coincide. We discuss the first five variables of the combined ranking considering the previous findings in the literature.
Three variables related to a company’s capital structure are among the most important: (1) ‘sources of short-term financing’, (2) ‘difficulty of sources of financing’, and (4) ‘preference for funding sources’. Table 3 presents the results (using the original scales) of the responses on the ‘preference for funding sources’ and the ‘difficulty of sources of financing’ in the training dataset before rescaling and computing them as final features.
Table 3 indicates how companies that innovate and show a preference for some financing sources have an average qualitative preference for internal funds and bank loans or loans from suppliers or clients first, funds from existing shareholders or partners and funds from new partners second, and informal loans from relatives or friends finally. Companies that do not innovate and have preferences for funding sources prefer, on average, internal funds first and then bank loans or loans from suppliers and customers. These companies then prefer funds from shareholders or existing partners and only then from new partners. The last preference is informal loans from friends and family. Despite these preferences, 48.4% of companies that innovate indicate no preference for any source of funding—a proportion greater than the proportion among companies that do not innovate at a 10% significance level using the chi-squared test (Campbell, 2007).
In fact, the hierarchy of financing preferences is quite similar between both types of companies—those that innovate and those that do not innovate. The first three sources of financing preferred by both types of companies are the same, and the last two sources of financing in order of preference are also the same but are in a different order. However, companies that innovate have a significantly greater preference for new partners or capital investors than companies that do not innovate, and the same happens with preferences for funds from shareholders or existing partners. In addition, companies that do not innovate prefer significantly more informal loans or funds from family and friends than companies that innovate.
Verification of the average difficulty with which companies evaluate obtaining different sources of financing indicates that companies (whether or not they innovate) prefer the two more easily obtainable sources of internal funds and bank loans. Moreover, no statistically significant differences exist in the perceived difficulty of obtaining both sources. However, companies that innovate consider it easier to obtain the other three secondary sources than companies that do not innovate—and these secondary sources are precisely those preferred by companies that innovate. It should be noted that the hierarchy of preferences to obtain each funding source for companies that do or do not innovate coincides with the hierarchy of the perceived difficulty of obtaining such sources of financing.
In summary, companies that innovate do not differ significantly in their preference or perception of the difficulty of obtaining such sources in the two most preferred sources of financing, which are the easiest to obtain. However, companies that innovate have a stronger preference for secondary funding sources that are easier to obtain than do companies that do not innovate. In other words, when an innovative company prefers a secondary financing source, its preference is probably influenced by the fact that it is easier to obtain this source, on average, than for a company that does not innovate.
In contrast, the rescaled ‘sources of short-term financing’ variable qualitatively differs on average between companies that innovate (0.05) and companies that do not innovate (0.00), whereas the rescaled ‘sources of long-term financing’ variable does not differ qualitatively between the two types of companies (both scores are −0.25 on average). It should be recalled that, by our definition, using a less external source of financing results in the ‘sources of short-term/long-term financing’ variables increasing further than when using a more external source. Accordingly, companies that innovate use more external short-term financing sources than companies that do not innovate, but they do not differ regarding the use of long-term sources of financing.
Table 4 shows the average use of each source of short- and long-term financing (in the training dataset), measured in terms of the percentage of total short- and long-term financing used by companies that innovate and do not innovate. In the short term, companies—whether or not they innovate—use more internal funds or retained earnings and then bank loans or credit from suppliers or customers. In contrast, in the long term, they use more bank loans and credit from suppliers or clients and only internal funds or retained earnings as a secondary source. In each case, the first two sources of funding are used more than the rest of the sources.
Additionally, Table 4 shows that no significant difference exists between the proportion of the use of the two main sources (internal funds or retained earnings and bank loans or credit from suppliers or customers) between companies that innovate and those that do not innovate. However, significant differences exist in the short and long term in the proportion of the use of funds from existing shareholders or partners, which is greater for companies that innovate. In any case, this proportion is small, at approximately 5% to 6% of the total funding. In addition, companies that innovate do not use funds from informal loans, family or friends.
In summary, in the short term, companies (whether or not they innovate) use more internal funds or retained earnings and then bank loans or loans from suppliers and customers, which are the most preferred sources of financing, as shown in Table 3. However, in addition, companies that innovate do not use informal loans or funds from family and friends, and this source of financing is precisely what they prefer less and is more difficult to obtain than for companies that do not innovate (Table 3). Likewise, companies that innovate use more funds from existing partners or shareholders than companies that do not innovate. These funds represent a more preferred source of funding and are easier to obtain for companies that innovate than for companies that do not innovate (Table 3). In other words, in companies that innovate, there is a coincidence between the actual use of funding sources, the preference for these sources and the difficulty in obtaining them, which does not happen in companies that do not innovate, especially regarding secondary sources.
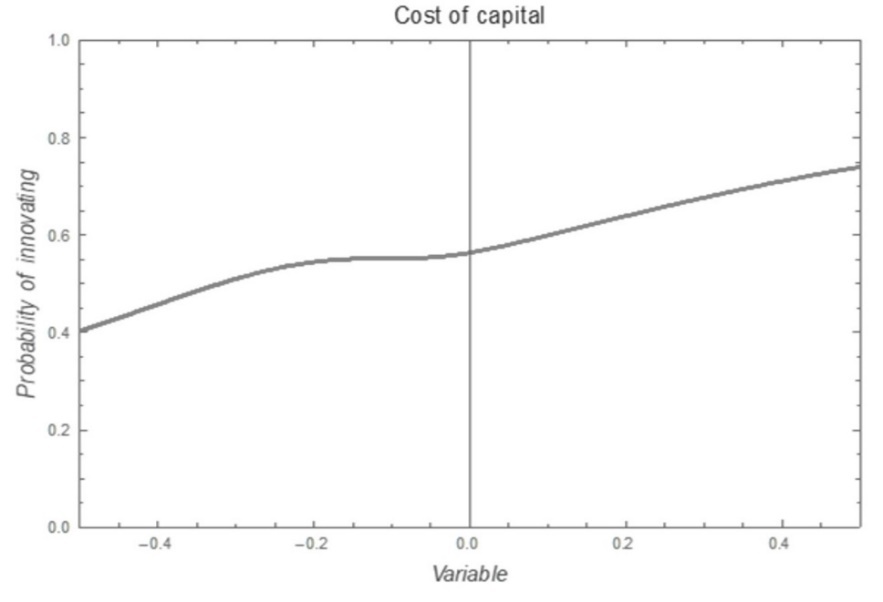
In the combined ranking of the importance of the variables from the nine predictive models of the presence of innovation, the third variable is the cost of capital. The variable ‘cost of capital’ refers to the expected return to remunerate stakeholders’, especially shareholders’ opportunity costs. The cost of capital, as investors’ expected return, is not significantly different for companies that innovate (18.13%) and do not innovate (17.98%), although the marginal graph of the probability of innovating (for a company with median values for the other variables) shows that increasing the cost of capital increases the probability of innovating (Figure 5). This result is unique because the empirical evidence of some studies suggests that a high cost of capital decreases the probability of developing innovation projects (Baldwin & Lin, 2002; Bunduchi & Smart, 2010; Mata et al., 1995).
Finally, the fifth most important variable in the combined ranking was ‘profile of the manager’, a control variable. Disaggregated into its two components of education and experience of the manager, the results show that managers of companies that innovate have a qualitatively higher level of education (3.61) compared to managers of companies that do not innovate (3.46) on a scale where 1 indicates that the maximum degree obtained is a high school diploma, 2 indicates a technician degree, 3 indicates a university degree, 4 indicates a specialization, 5 indicates a master’s degree and 6 indicates a doctorate.
5. Discussion
The results obtained provide new evidence on the importance of the variables associated with financing that most influence the development of SME activities in an emerging country such as Colombia. Among the results, it should be noted that three of the most important variables for an SME to develop innovation activities are closely related to the capital structure: (1) ‘sources of short-term financing’, (2) ‘difficulty of funding sources’, and (4) ‘preference for funding sources’.
Regarding the ‘preference for funding sources’ variable, the results obtained are consistent with the empirical evidence that concluded that the companies that innovate follow the order of the preferences of the funding sources predicted by pecking order theory (Myers & Majluf, 1984)—that is, once companies develop innovation activities, they make greater use of internal funds, but as the culture of innovation is imposed on the company, external funds are used more (Bartoloni, 2013; Kerr & Nanda, 2015; Ullah et al., 2010). This evidence is also related to the result obtained on the variable ‘sources of short-term financing’, which suggests that companies prefer to finance their innovation projects with internal funds in the short term (Ayranci & Ayranci, 2016; Serrasqueiro et al., 2016). In the Colombian case, studies such as the one by Sierra et al. (2009) suggested that Colombian manufacturing companies—especially large and small companies—finance their innovation projects with internal funds.
Regarding the variable ‘difficulty of sources of financing’, it has been previously concluded that long-term debt decreases the probability of developing innovation activities in SMEs (Aiello et al., 2019; Baldwin et al., 2002). This suggests that companies finance their first innovation activities with easier-to-obtain internal sources and retained earnings. These results are consistent with those of Barona-Zuluaga et al. (2015) and Méndez Morales (2019) who concluded that innovative Colombian companies use internal resources first, bank financing second and supplier credit finally, as was the case with the SMEs in our sample in the short term.
One of the most significant results of this study is the capital cost variable as the third most relevant factor for the development of innovation activities in SMEs. Our result contradicts what is found in the empirical evidence of studies that suggested that a high cost of capital decreases the probability of developing innovation projects (Baldwin et al., 2002; Mata et al., 1995; Xu, 2020). In fact, in our study, we conclude that at a higher cost of capital, Colombian SMEs are more likely to develop innovation projects. This result suggests that there is a greater probability of obtaining a high expected return from the exposure to innovation risk of SME fund providers.
Finally, the findings on the control variable ‘profile of the manager’, which appears in the study as the fifth variable that most influences the development of innovation activities, agree with the findings of some studies that suggest that the education of the manager positively influences the development of innovation activities (Ahluwalia et al., 2017; Becheikh et al., 2006; El Hanchi & Kerzazi, 2020; Mahto et al., 2018; Souitaris, 2002).
Based on the results obtained, we consider that two critical impacts of the present investigation can be foreseen from the point of view of public policy. First, Colombian managers can identify key inputs to enhance the likelihood of developing innovation activities and can diagnose their organizations based on these key inputs. Similarly, managers can further understand the effect of innovation financing on innovation. Second, public policymakers can use predictive models to gain insights into what their policies should be if they want them to be based on evidence. Such models will allow policymakers to quantitatively evaluate the relevance of the policies and, to some extent, their possible effects.
In the Colombian case, a potential application of the results we found could be aimed at suggesting to the Colombian government how to strengthen its aid to SMEs through intervention in some of the variables associated with financing that most influence the development of innovation. For example, the variable related to the difficulty of funding sources could be influenced by increasing the credit supplied by public banking in the long term with interest rate subsidies for innovation projects (Hall et al., 2016; Hottenrott et al., 2017; Merz, 2021).
6. Conclusions
This research aimed to provide a general overview of the variables that are associated with financing that are most important in determining innovation. The answer to the research question adds a new perspective to the global knowledge on the relative relevance of variables associated with financing in predicting the presence of innovation, especially in Colombian SMEs.
The main result of the research was a hierarchical ranking in which the variables associated with financing are sorted according to their degree of importance when predicting the presence of innovation. This study is also one of the few that exists on financing innovation in emerging markets and SMEs, and it seeks to be, in turn, thematically comprehensive and large scale in this context.
Furthermore, as a result of the work achieved, new concrete models for predicting innovation were offered that use some of the most advanced recent predictive analysis techniques. Such models not only constitute a new milestone in the literature on the field but also set a precedent for subsequent authors.
The findings indicate that the most critical variables for the presence of innovation are related to how financing occurs (financing preferences, short-term use of financing, and difficulty in obtaining financing) and indirectly to expected profitability. Some less critical variables—different from control variables—are related to managers, their profiles and their risk aversion. Secondary variables, such as company characteristics related to accessing some type of credit, are still important. In conclusion, regarding the decision to innovate, the variables associated with the sources and uses of financing seem to predominate; however, the variables related to the characteristics of the company and credit do not.
Future research could extend the present results to the international context and consolidate the generality of the feature engineering and predictive methods used here through a broader sample. The use of the ‘variable importance methodology’ in this context is an unprecedented novelty that would allow for replicating the findings easily in other settings. Furthermore, using a more recent sample may corroborate the time stability of the results since our original samples date back to 2016.
Disclosure statement
No potential conflict of interest was reported by the authors.
Funding
This work was supported by Colciencias [Grant 617 of 2013] and the Universidad del Valle [Grant for Doctoral Students of 2016].
The definitions of small- and medium-sized enterprises (SMEs) vary across countries and often use the number of employees (OECD, 2005, p. 17). Law 905 also suggests, alternatively, the use of the number of personnel in the plant; however, we did not rely on this measure since only the value of assets is widely and publicly available in Colombia, and not all enterprises have production ‘plants’.
For definitions, see Table B1 in the Online Appendix at https://rebrand.ly/FinancialDeterminants.