
Introduction
Over the last few decades, the world has been moving on a trajectory towards sustainability and the idea of Sustainable Development Goals (SDGs) has quickly gained ground. SDGs embrace the so-called triple bottom line philosophy (Sachs, 2012), which suggests that organisations should balance financial, environmental, and social dimensions of management to be not just the “best in the world,” but “best for the world” (Elkington, 2018). Companies play a key role in solving environmental and social issues, including resource efficiency, waste reduction, energy use, responsible behaviour etc. This has led to a greater interest in eco-innovations, green innovations and sustainable innovations, together with the role they play in business performance (Boons et al., 2013; Carrasco & Buendía-Martínez, 2016; De Marchi, 2012; Huang & Li, 2017). Companies extensively express their need to develop their capabilities to work with sustainability (Obal et al., 2020; Schulte & Hallstedt, 2017; Shields & Shelleman, 2015) and contribute to the sustainable development of society (Brundtland, 1987). Velasco Vizcaíno et al. (2021) have demonstrated that firms that pursue SDGs by fostering working environments that include organisational capabilities, such as corporate frugality, servant leadership and job satisfaction, have a greater chance of enhancing Corporate Social Responsibility (CSR) attitudes among employees. This organisational approach has been reinforced by the growing pressure from customers and other stakeholders to implement sustainable initiatives and monitor sustainable performance (Weidner et al., 2020). Increasingly studies have examined sustainable technologies that help to combine sustainability with innovation and the way this combination can bring competitive advantage (Adams et al., 2016; Kneipp et al., 2019).
Therefore, the most prominent notions adopted in the literature to describe ‘innovations designed to reduce the environmental burden’ are termed “green”, “eco”, “environmental” and “sustainable” (Adams et al., 2016; Y.-S. Chen et al., 2006; Iñigo & Albareda, 2016; Oltra & Saint Jean, 2009). Several studies emphasise the role that green innovation plays in enhancing the competitive advantage of companies in terms of product innovation, process innovation and managerial innovation (Chang, 2011; Chiou et al., 2011). Huang and Li (2017) found that green product and process innovations have a positive impact on the competitive advantage and organisational performance of companies, while also improving their corporate image (Chang, 2011; Chiou et al., 2011). Küçükoğlu and Pınar (2015) showed the positive effect of green innovation, which includes green product and process sub-dimensions, on overall company performance in Turkey. While Sustainable Innovation (SI) has been used interchangeably with green innovation, environmental innovation or eco-innovation, a new perspective on meeting SDGs has emerged that enables companies to grow while addressing both environmental and social needs and demands (Weidner et al., 2020). Compared with environmental innovation or eco-innovation, SI covers a broader range and incorporates societal, environmental and economic aspects (Adams et al., 2016; Afeltra et al., 2021; Calik & Bardudeen, 2016), making it a more demanding process for producing radical change (Boons & Lüdeke-Freund, 2013) because of the organisational changes and innovation development processes involved (Blum-Kusterer & Hussain, 2001).
Additionally, SI includes any new or significant improvement of products, services, capabilities, and technological or organisational practices, commercialised or internally implemented, that provide not only economic benefits but also positive social and environmental impacts (Calik & Bardudeen, 2016). Most of the studies have tackled social and environmental aspects separately, while there is a need for research that integrates all three dimensions of sustainability (Goyal et al., 2013). Just a few studies show the impact of innovations that try to balance the Triple Bottom Line dimensions (Elkington, 1999), integrating social, environmental and economic responsibilities on company sustainable advantage and performance (Kneipp et al., 2019; Weidner et al., 2020).
Therefore, little is known about the relationship between SI practices and the Organisational Performance (OP) of firms, as most of the studies provide conceptual frameworks and lack empirical evidence. This study attempts to address these gaps by examining the benefits of sustainable innovation practices and their impact on organisational performance and competitive advantage. Drawing from the resource-based view (RBV) of the firm, this study assess the impact of sustainable innovation practices on organizational performance and provides insights on factors that firms should consider when implementing a new sustainable strategy (Goyal et al., 2013; Neely et al., 1994). By adopting a survey-based method and conducting semi-structured interviews in the Italian context, we test the following hypotheses: 1) “Sustainable innovation practices seeking to produce economic, social and environmental benefits will be positively associated with manufacturing companies’ performance”; and 2) “Technological complexity will be related to the adoption rate of sustainable innovation practices such that smaller manufacturers will be less likely to adopt more complex innovation practices.”
This study contributes to the existing literature on SI in several ways: first, to the achievement of SDGs by investigating the role of SI practices on OP of manufacturing companies, looking at the combined effect of the economic, environmental and social dimensions of SI; second, by exploring some of the drivers and barriers to the implementation and development of SI. Finally, this study builds on the RBV (Barney, 1996) of firms and provides insights on how practitioners may allocate their resources to boost sustainable innovation activities and enhance OP within a long-term perspective of competitiveness.
Theoretical background
Sustainable Innovation (SI)
SI and its practices have received growing attention because companies are experiencing lower growth as a result of environmental issues (Adams et al., 2016; de Medeiros et al., 2014; Handfield et al., 2005; Sharfman et al., 2009; Zhu et al., 2008), which are recognised as transcending organisational and societal boundaries (Clarke & Roome, 1995). These are, for example, represented by the need of moving from natural resources extraction to material and energy reuse and waste, improving air quality, preserving eco-systems and community ills (Nadim & Lussier, 2010).
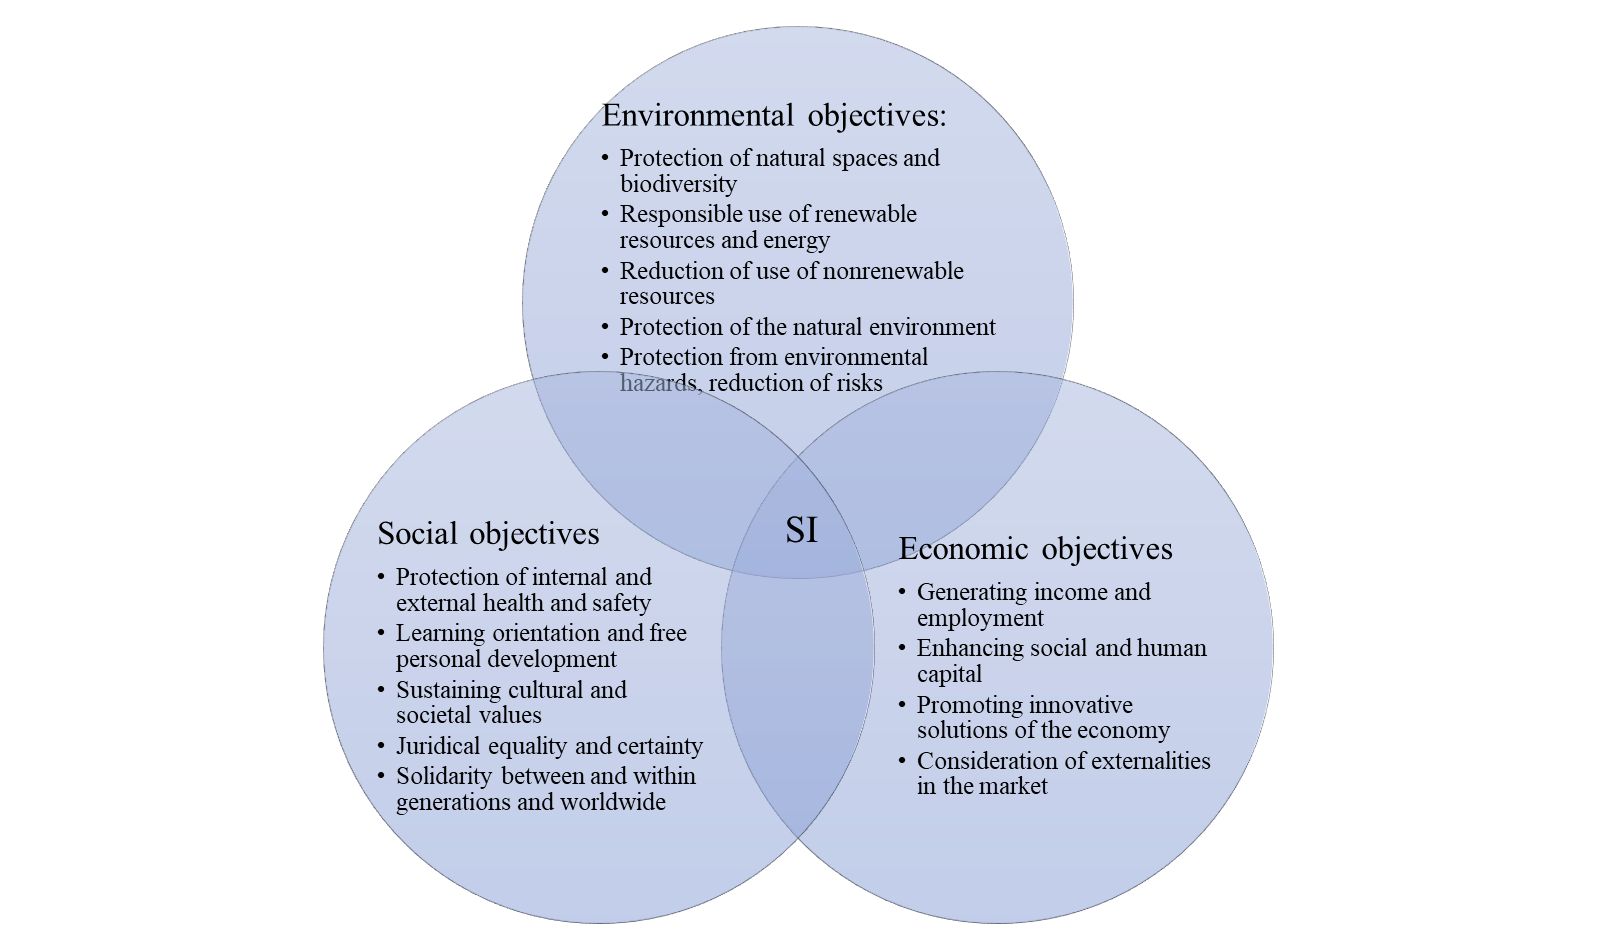
Moreover, SI adopts a broader focus, which includes social issues and the needs of future generations rather than just economic objectives and environmental burden (Afeltra et al., 2021; Ketata et al., 2015). For clarity, the three pillars of SI are shown in Figure 1.
).png)
Overall, the knowledge required by SI is both more uncertain and more complex than the information needed for traditional innovations (Ketata et al., 2015), which usually involve the development of new resources and competencies, processes and technologies, but it is vital for organisational survival, long term growth and organisational competitive advantage (Barney, 2001; Teece, 2010). SIs adopt different product, process innovations, resources and capabilities, linking them more to the holistic and long-term process, which includes social objectives (Boons et al., 2013), promoting the sustainable development of the firms.
In literature, there are several definitions of SI (S.-H. Chen, 2016), including “sustainability-oriented innovation” (Klewitz & Hansen, 2014) and “sustainability-related innovation” (Wagner, 2010), and it is often used interchangeably with “eco-innovation” and “environmental innovation” (Schiederig et al., 2012). By putting them together we provide a general definition of SI as the implementation of new ideas, capabilities, processes and products that reduce or avoid environmental impact for the benefit of the community (Delmas & Pekovic, 2018; Hellström, 2007; Rennings, 2000; Rennings & Zwick, 2002), while at the same time trying to make a profit (Delmas & Pekovic, 2018; Di Domenico et al., 2009), contributing to the sustainable competitive advantage of the firm (Barney, 2001).
Earlier studies used different outcomes to measure SI, for instance, a reduction in resource/energy consumption of environmental stress, and the improvement of health and safety (Ketata et al., 2015), total greenhouse gas emissions, total water use, and total waste generated (Hoang et al., 2020). Xing et al. (2020) also explored different types of SI with a mediating role in the relationship between environmental regulation and financial performance. However, most sustainable innovation studies provide conceptual frameworks and lack empirical evidence, with the exception of Calik & Bardudeen (2016) (Kusi-Sarpong et al., 2019), who identified a measurement scale that includes three aspects: Economic, Environmental and Societal, in line with the “Triple Bottom Line” philosophy (Elkington, 1999). First, the Economic aspect is measured in terms of innovation expenditure, the development and commercialisation of new products, and the adoption of new sustainable manufacturing processes. The economic aspects of SI thus concern the amount of resources and the ability of firms to generate a continuous stream of innovations which can, in some scenarios, be crucial for the survival of companies in a dynamic competitive environment (Artz et al., 2010). R&D expenditure is found to positively influence new product development with a positive impact on innovation and industrial performance (Emodi et al., 2017). Second, sustainable innovative companies have usually adopted environmental considerations that are integrated into company systems. This explains the need to include the Environmental dimension in our model, which refers to the use of other resources (such as renewable resources), life management, certification and eco-labels, waste emission and pollution. These aspects are becoming extremely important for organisations to ensure their sustainability, given also the limited availability of non-renewable resources (Chaabane et al., 2012). Furthermore, consumers are more aware of environmental issues and eco-labels on products are a way to certify the lower impact on the environment (Houe & Grabot, 2009). Therefore, firms should also consider that these certifications are more attractive and competitive in the market.
Ultimately our measure of SI englobes the Societal dimension (health and safety of production processes, durability, quality and ergonomics of products), which has rarely been investigated in combination with economic and environmental measures (Alerasoul, Afeltra, et al., 2022; Richter et al., 2019). Successful organisations need to effectively manage their human resources with sustainability as well as financial goals in mind in order to produce high-quality products, with a reduction of anxiety, absenteeism and increased job satisfaction (Boudreau & Ramstad, 2005; Gilbreath & Montesino, 2006). To develop organisational sustainability, human resource strategies must respond to the economic, social and environmental strategies (Jabbour & Santos, 2008).
The relationship between SI and OP
Since Elkington (1999) introduced the concept of sustainability (called ‘The Triple Bottom Line’ or ‘three pillar model’, which includes all three dimensions of sustainable development), several studies have suggested that company performance, business planning and decision-making should include economic, environmental and social aspects at the same time (Beske, 2012; Chaabane et al., 2012; Nadim & Lussier, 2010; Parhankangas et al., 2014; Rondinelli & Berry, 2000; Shields & Shelleman, 2015). This trajectory has been reinforced with the introduction of SDGs. For instance in terms of environmental commitment, businesses need to develop environmental technologies and practices as a source of competitive advantage and superior performance (Gomez-Conde et al., 2019; Shrivastava, 1995). The ultimate goal of any organisation is to improve its performance, and one of the main challenges manufacturing companies face when adopting new management practices is to meet short-term and long-term organisational objectives (Agudo Valiente et al., 2012). The improvement of overall company performance, in particular, organisational performance, is an important issue for organisations (Masa’deh et al., 2018), even if its concept and measurement are quite difficult to define. Therefore, there is a lack of consensus among researchers as to what OP means and how it should be measured (Abu Jarad et al., 2010; Hernaus et al., 2012; Masa’deh et al., 2018). Earlier studies have mainly applied different financial indicators to measure OP (Alipour, 2012; Green & Inman, 2005; Ho, 2008; Yu et al., 2010) because the main sources of information of an organisation are its financial statements. Previous studies have mostly used financial measures to evaluate performance due to sustainability (Goyal et al., 2013). However, financial indicators alone are not enough to manage and fully understand an organisation’s performance. In many cases, companies have to deliver value, not only to their shareholders but also to other stakeholders; this has required contemporary performance measurement models to include both financial and non-financial criteria (Bogicevic et al., 2016; Hernaus et al., 2012; Ittner et al., 2003). A change in perspective came about in the mid-1980s when organisations increasingly implemented non-financial performance measures (Hernaus et al., 2012). Academics, practitioners and policymakers started to emphasise non-financial criteria when evaluating company performance because financial statements failed to account for some important information, such as quality, responsiveness, customer demands, competitors’ performance, the number of new products developed and employee turnover (Hernaus et al., 2012).
On the other hand, the transition to a green economy increased the need to strategically integrate environmental sustainability issues into business and product development operations, leading to potential benefits, including sales growth, more efficient use of resources, higher return on investment, new market penetration, product differentiation, etc. (Dangelico & Pujari, 2010). For example, in a study among Turkish manufacturing companies, Ar (2012) found a positive and significant relationship between green product innovation and OP. Several studies have addressed the importance of investment in green innovations in obtaining positive economic improvements and benefits (Y.-S. Chen, 2008; Huang & Li, 2017; Peng & Lin, 2008; Przychodzen & Przychodzen, 2015).
Sustainable innovation practices in manufacturing companies include the development of new products and processes that can provide environmental and social benefits and improve manufacturing processes (Bos-Brouwers, 2010) reducing the use of raw materials and energy. These new improvements, commercialised or adopted internally, will have not just economic benefits but also a positive social and environmental impact (Calik & Bardudeen, 2016). The economic aspect of SI is measured in terms of innovation expenditure, the development and commercialisation of new products, and the adoption of new sustainable manufacturing processes (Calik & Bardudeen, 2016). This is typically the most important aspect driving companies that want to implement environmental management practices (Zhu & Sarkis, 2004). In a fast-changing world, the development of new products and processes helps organisations adapt to changes in their environment and remain competitive in the long term (Ledwith & O’Dwyer, 2009), which is why a better understanding of the benefits in terms of OP in Italian manufacturing firms is of great interest. Even though the development of sustainable new products that address environmental issues has been widely investigated, it is still not clear whether these products improve a company’s performance.
As stated above, another aspect incorporated in SI is the environmental dimension. The allocation of corporate resources towards these aspects can improve social welfare, which will improve the relationship with key stakeholders (Barnett, 2007), and ultimately have a positive effect on the overall environment. Several studies also support the hypothesis that environmental collaborations with supply chain partners and good environmental performance will pay off in terms of OP (Green et al., 2012). Ultimately, sustainable innovative companies have adopted environmental considerations, engaging in environmental business practices that are integrated into company systems and can help companies secure a competitive advantage and enhance their OP (Alerasoul, Tiberius, et al., 2022; El-Kassar & Singh, 2019).
Finally, the societal dimension of SI is also expected to positively contribute to OP. According to Glavas and Godwin (2013), when employees have a positive perception of their organisation’s corporate social responsibility, their identification with and commitment to the organisation is enhanced. Significant improvements in employee well-being and work-related exhaustion have been found to be essential factors in an organisation’s success (Anderz & Arnetz, 2005; Gilbreath & Montesino, 2006), with HRM also playing an important role in sustainability (Boudreau & Ramstad, 2005).
In addition, the durability, quality and ergonomics of products can enhance customer appreciation of the company’s products, which is fundamental for long-term organisational success (Morrow, 1997), as lifetime issues are gaining recognition within the consumer market (Knight & Jenkins, 2009). These overall aspects may lead to an improvement in the company’s reputation, which is widely recognised as an alternative measure to financial performance (De Miguel De Blas, 2020).
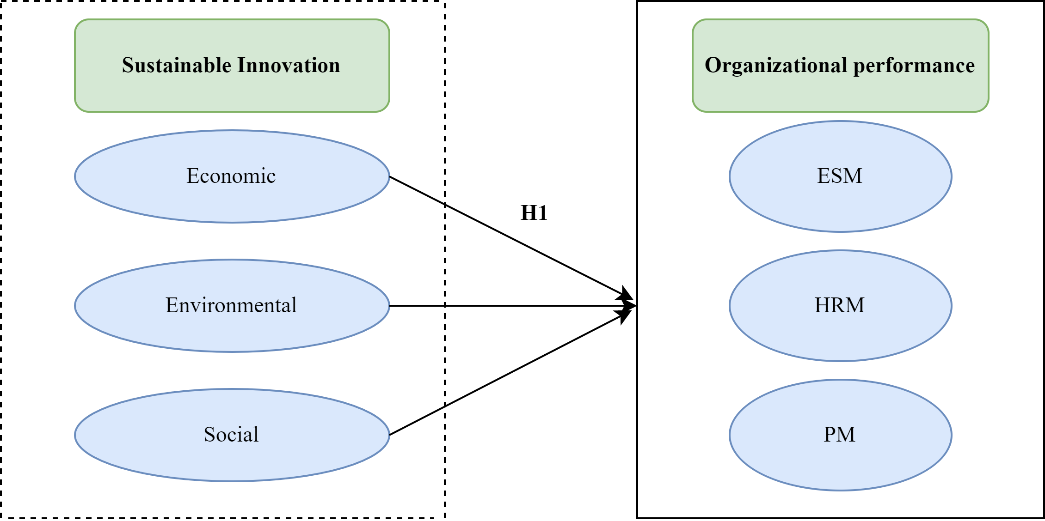
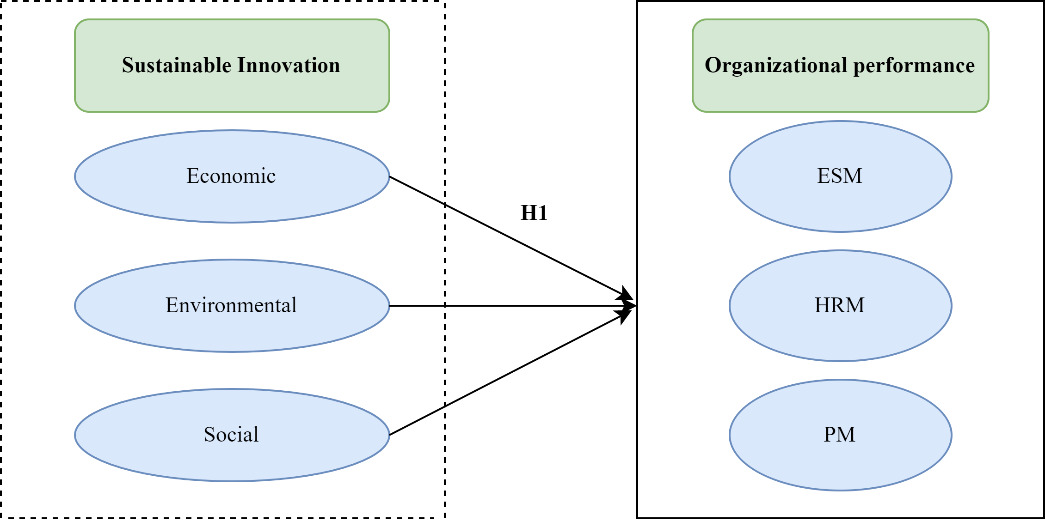
Considering the aforementioned arguments, we can expect that sustainable innovation practices will improve organisational performance. Thus, we propose the following hypothesis, as illustrated in Figure 2:
Hypothesis 1 (H1): Sustainable innovation practices seeking to produce economic, social and environmental benefits will be positively associated with the organisational performance of manufacturing companies.
Technology complexity and SI
Unlike other innovations, sustainable innovations can lead firms to reconcile economic, social and environmental goals with “win-win-win” strategies towards sustainability (Elkington, 1994). Manufacturing firms are expected to continuously improve their products with novel solutions and contribute to building a more sustainable society by also taking advantage of new technologies to adapt and develop sustainable innovation practices. This implies that firms develop and organise business networks with several stakeholders to find innovative products and solutions that impact life cycles. This strategic business behaviour is facilitated by a proper technology mix (Isaksson et al., 2018) and by adopting eco-efficiency approaches, such as eco-design approaches (Knight & Jenkins, 2009). However, Knight and Jenkins (2009) argue that these techniques must include process-specific customisation; they are, therefore, not immediately applicable or widely adopted. For small and medium-sized enterprises in particular, the application of eco-design tools is not widely adopted as strategic goals regarding environmental product policies are rare in SMEs (Schischke et al., 2006).
Most common sustainable innovations in Italy include: the adoption of green electricity, industrial waste recycling; the use of renewable resources; environmentally friendly material; electronic waste recycling; energy conservation industry; clean transportation etc.
Horbach (2008) showed how technological capabilities, which comprise physical and knowledge capital stock, spark environmental innovations thanks to R&D investment and organisational learning. Technology push is one of the factors influencing a firm’s decision to introduce eco-innovations (Horbach, 2008). In fact, new technologies are continuously advancing, and they are likely to affect company performance (O’Regan & Ghobadian, 2005).
Furthermore, companies need to integrate sustainability issues within different subject areas and implement them with digital solutions (Isaksson et al., 2018). According to Isaksson et al.(2018), the main challenge is to empower engineers to implement these digitalised solutions and prioritise sustainable solutions. Thus, technical complexity can constitute one type of barrier to the adoption of eco-design implementation practices (Buzuku & Kässi, 2019).
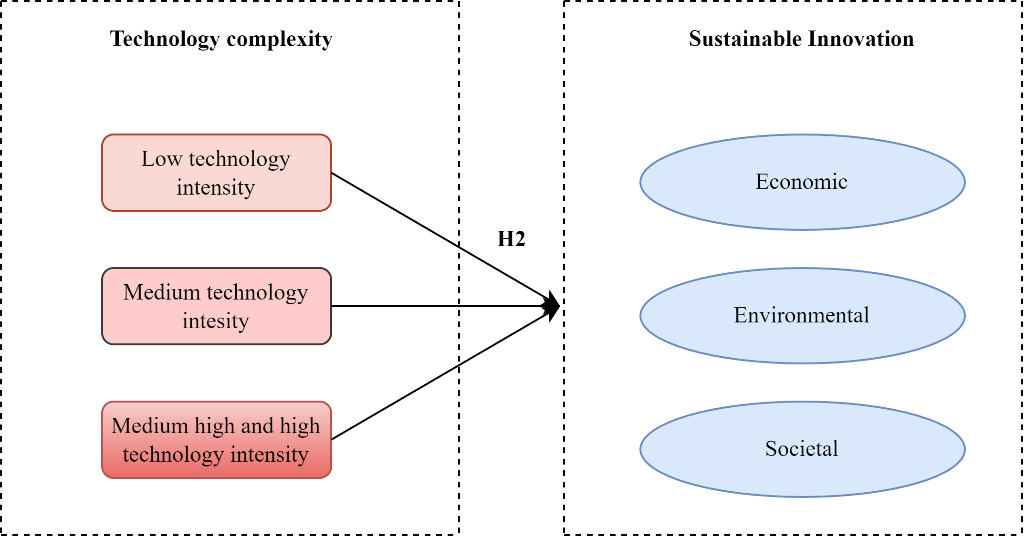
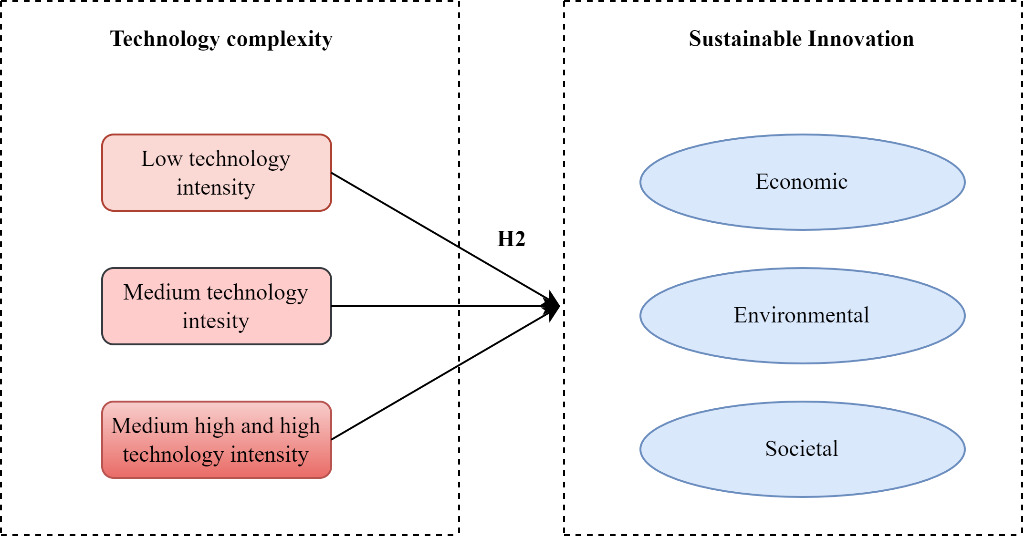
Therefore, we argue that small firms are less likely to adopt more complex sustainable innovation practices, hence, we hypothesise the following, as illustrated in Figure 3:
Hypothesis 2 (H2): technological complexity will be related to the adoption rate of sustainable innovation practices such that smaller manufacturers will be less likely to adopt more complex sustainability-oriented innovation practices.
Method
Research instrument
As a first step to test the hypotheses H1 and H2, a survey was carried out among Italian manufacturing companies based on a questionnaire designed for data collection (Forza, 2002) (See Table 7 in Appendix). At a second stage of the study, some semi-structured interviews were carried out with key personnel in five companies working in the implementation of the practices, to further investigate some aspects of H2. For the development of the questionnaire we adopted the SI measurement scale developed by Calik and Bardudeen (2016), which provides the first recognised scale to measure SI and encompasses concepts of environmental, green, and eco-innovation through the Economic, Environmental, and Societal dimensions according to the Triple Bottom Line philosophy (Elkington, 1999). Next, we suppose that companies implementing these activities develop an outward-looking or relational capability in order to create more valuable relationships with a broader range of stakeholders who are involved in the innovation processes. We expect these activities to positively influence OP as the organisational component that should explain the transformation and evolution a company experiences due to SI implementation (Iñigo & Albareda, 2016). The OP construct and corresponding items (External stakeholders management measures (ESM), Employee or HRM measures (HRM), Process measures (PM)) were adapted from Hernaus et al. (2012). It includes the external stakeholders perspective related to customers, employees, the relationship with suppliers and also the process benchmarking perspective.
The final questionnaire was made up of the following three sections: the first one included questions related to the SI construct (12 items); the second was associated with OP (10 items), and respondents could answer all items on a 7-point Likert-type scale, from 1 ‘strongly disagree’, to 7 ‘strongly agree’; the last section included five questions on demographic information about the respondents (age, gender, level of education, the role, years of experience within the organisation, etc.).
The investigation involved manufacturing companies in Italy. Furthermore, the Italian context was chosen due to its increasing importance in terms of the green economy. According to the GreenItaly Report 2020, Italy might become the leader in the sustainable revolution of the economy. We focus on manufacturing firms as their role regarding environmental practice and strategies has substantially evolved over time (Sarkis, 2001). Industrial manufacturing firms are considered a driving force in reducing the negative impact on the environment, as also detailed in the Organisation for Economic Co-operation Development (OECD, 2009) report. A recent review by Buzzao & Rizzi (2021) confirms this trend as many studies are focused on manufacturing firms.
In responding to these environmental issues, innovation is a key factor through the development of technologies that limit or control pollution and the implementation of processes that minimise the use of raw materials and energy. Recent studies indicate that the adoption of innovative sustainable management practices drives the performance of manufacturing companies (Nidumolu et al., 2009). The strategic importance of this sector has raised our level of interest in this investigation, being aware, at the same time, of the need to expand the analysis in the future to other contexts, such as the agricultural sector.
Design and sample
The target population was made up of Italian manufacturing companies selected according to NACE Rev 2 Codes (from 10 to 32) extracted from the AIDA Bureau van Dijk database. A stratified random sampling approach was adopted to increase the representativeness and generalisability of the results. This method has previously been successfully applied (Lazzarotti et al., 2015) and it is the most appropriate method for data collection purpose (Goyal et al., 2013). The firm was chosen as the unit of analysis thus individuals responded on behalf of the firms. The final sample was made up of 8,880 firms (10% of the target population) included in the AIDA database available at LIUC University. When e-mailing the companies, we asked for the questionnaire to be sent to the relevant person to respond in the most appropriate way; most of the respondents were the CEOs of the companies or managers with more than nine years of experience within the company. The sectoral composition of the statistical population is presented in Tables 9 and 10 in the Appendix. The data collection began at the end of 2019 and 371 fully completed questionnaires were returned at the beginning of 2020. A follow-up was conducted after two weeks.
To improve cost-efficiency and quality, the data were then integrated with different modes of data sources, including online information and company reports. In most cases, the final respondents were small companies, 81% (299 companies) with fewer than 50 employees, 14% were medium-sized, with more than 50 and fewer than 250 employees, and only 5% were large companies, with more than 250 employees (see Table 1). Because of the difference in data magnitude, the control variable size was computed as the natural logarithm of the number of employees to prevent weighting the differences in company size in a linear way (Hemmelskamp, 1999); this is in line with existing literature focusing on the association between eco-innovation and company performance (Barba Navaretti et al., 2014; Cenni et al., 2015; De Marchi, 2012; Jové-Llopis & Segarra-Blasco, 2018).
Model of empirical validation
In the following section, the analytical tests of the model used in the empirical stage of the study are presented, including face validation, content reliability and structural validity.
Face validation
Since this study was conducted in Italy, several pilot interviews with bilingual people were conducted to check the wording for the translation of the questionnaire, which led to some minor changes. Before the launch of the survey, some calls were made to companies to check for the general propensity of respondents, and the average feedback was positive. The final response rate was 4.2%. Table 2 shows demographic results of the respondents. Most of them (70.35%) were male and CEOs (44.74%) with more than nine years of experience (72.22%). The respondents who selected the ‘other’ option in the questionnaire could decide whether or not to specify their current role within the organisation, which they did in 20 of the 90 responses (See Table 10 in Appendix). 81% (299 companies) of respondents were managers/executives of small-sized companies, which is in line with the traditional characteristics of the Italian context (Table 1 and 2). The highest percentage of respondents belonged to the machinery and equipment sector, NACE Rev 2 code 28 (14.8%) and to the manufacturing of fabricated metal products, other than the machinery and equipment sector, NACE Rev 2 code 25 (14%) (Table 8 in Appendix). These results are in line with previous studies (Lazzarotti et al., 2015).
Content reliability and structural validity
The exploratory factor analysis is performed as it is commonly used in research to ensure that all scale items involved to measure SI are part of the same factor (Bryman & Cramer, 2009). The Kaiser-Meyer-Olkin (KMO) statistic was 0.907 (Table 3), greater than the minimum criterion of 0.5, and Bartlett’s sphericity test was significant with p<0.0001; as such, the sample size was adequate for factor analysis (Tabachnick et al., 2019). The Principal Component Analysis (PCA) revealed that one component explained most of the variance in the sample (see Figure 8 in Appendix). All items were correlated to one component, as expected, SI constructs, with high factor loadings >0.5 (Table 4), and to test the reliability of total questionnaire items and for the construct, Cronbach’s alpha[1] was measured. All items of SI were above the threshold of 0.7, therefore the scale is reliable, showing strong internal consistency and no item was excluded (Pavot et al., 1991).
The measurement scale of SI consists of 10 items (Q1-Q10). Through factor analysis, we computed factor scores and then used them as independent variables in the subsequent analysis.
A linear regression analysis (commonly used in prediction studies) was used to test H1 and determine how the OP of Italian manufacturing companies changes with different levels of SI performance. OP as a dependent variable consists of three dimensions (Figure 2): 1) ESM, 2) HRM and 3) PM. The findings are shown in Table 5. The adjusted R square is 0.256 (statistically significant), indicating that the model can capture 25.6% of the variance in the dependent variable OP. It is also possible to exclude that the predictors are correlated, with no bias in the regression analysis. The collinearity statistics stated that there is no multicollinearity as the variance inflation factor (VIF) is lower than 10, and the tolerance is greater than 0.1 (Bowerman & O’Connell, 1990).
The results show that SI practices trigger the RBV with a positive, statistically significant impact on OP with a standardised beta coefficient of 0.495 with p<0.0001; therefore, the independent variable SI makes a unique contribution to explaining the OP of manufacturing companies. Sustainable innovation practices are found to be positive drivers of OP in Italian firms contributing to the sustainable competitive advantage.
We also examined the relationship between control variable size and the regressor factor score of SI. The Pearson product-moment correlation coefficient is not significant, which showed that there is no correlation between these two variables (Table 6).
The adoption of sustainable innovation practices and the level of OP
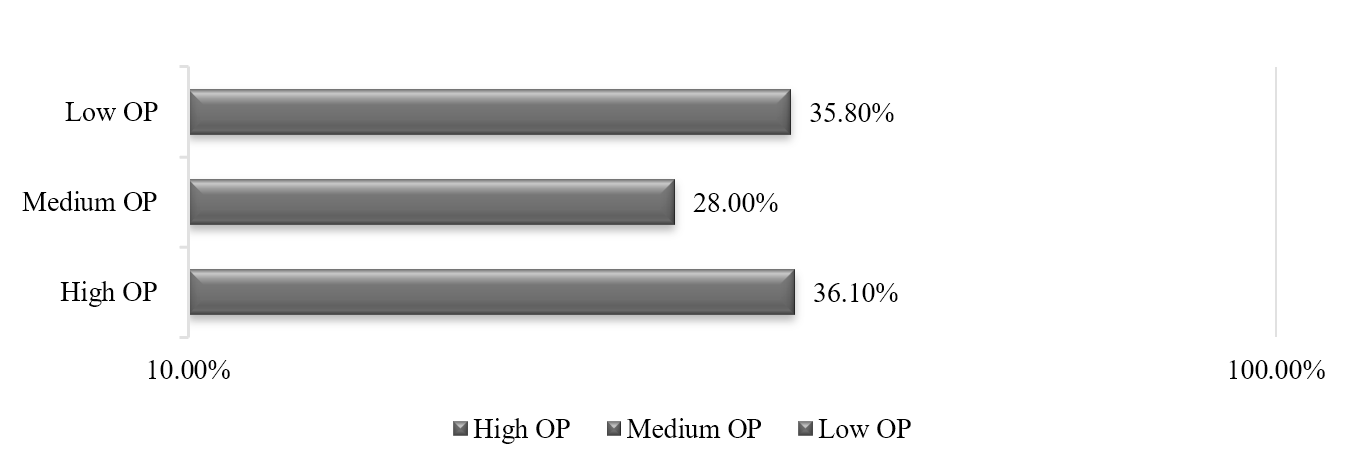
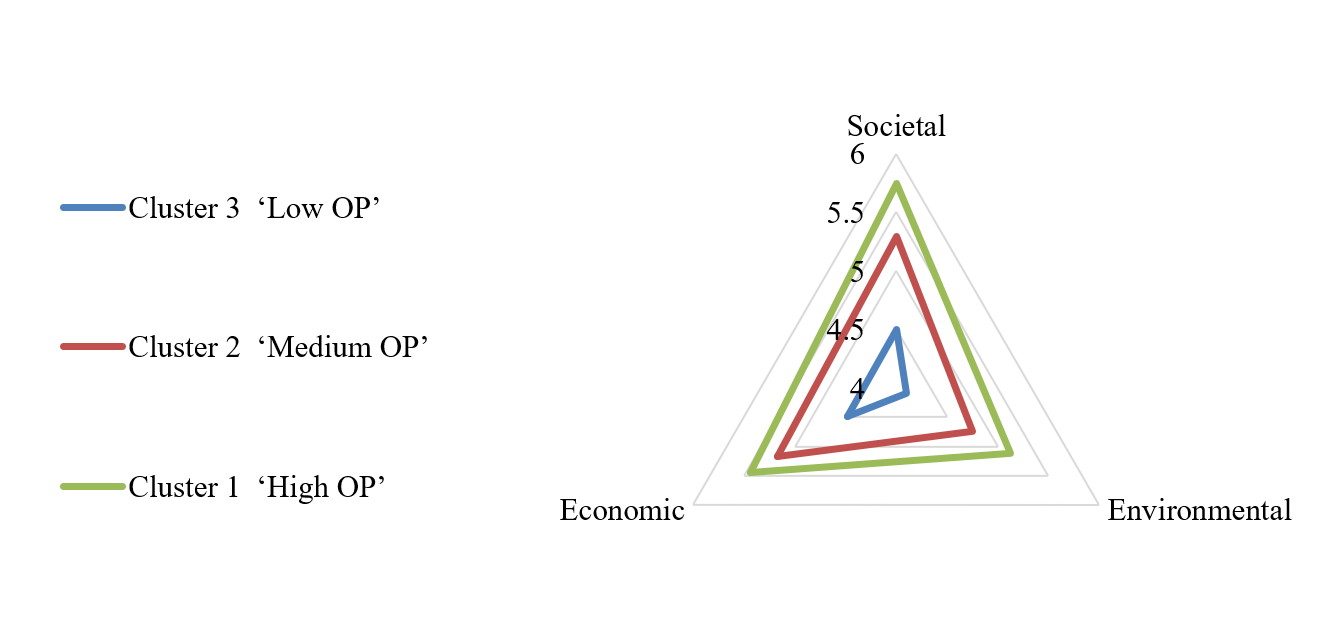
Following the analysis, the two-step cluster analysis was applied to examine whether all the dimensions of SI constitute positive drivers in the relationship between SI and OP, and each dimension (Economic, Environmental and Societal) was classified on three levels of OP (Low, Medium and High). Figure 4 shows the percentage of groups of manufacturing companies belonging to each cluster on three levels of OP. The first cluster, ‘High OP’, included 36.10% (134) of companies with high performance in OP; the second cluster, ‘Medium OP’, included 28.0% (104) of companies with a medium level of OP; the third cluster, ‘Low OP’, consisted of 35.8% (133) of companies with a low level of OP. However, in all three clusters (Low, Medium and High) the dimension of SI that scored highest was Societal, which showed that, within our sample of Italian manufacturing companies, managers had adopted policies with regard to workplace safety, product quality (lower product return rates) and ergonomic product characteristics (Calik & Bardudeen, 2016b). This means that appropriate organisational policies and customer satisfaction appear to constitute drivers to SIs. Overall, ‘High OP’ companies that showed greater OP (cluster 1 ‘High OP’) performed better in all three dimensions of SI than the other two clusters (see Figure 5). These results revealed that the three dimensions of SI are positive drivers of OP in Italian manufacturing companies.


The adoption of sustainable innovation and the level of technology intensity
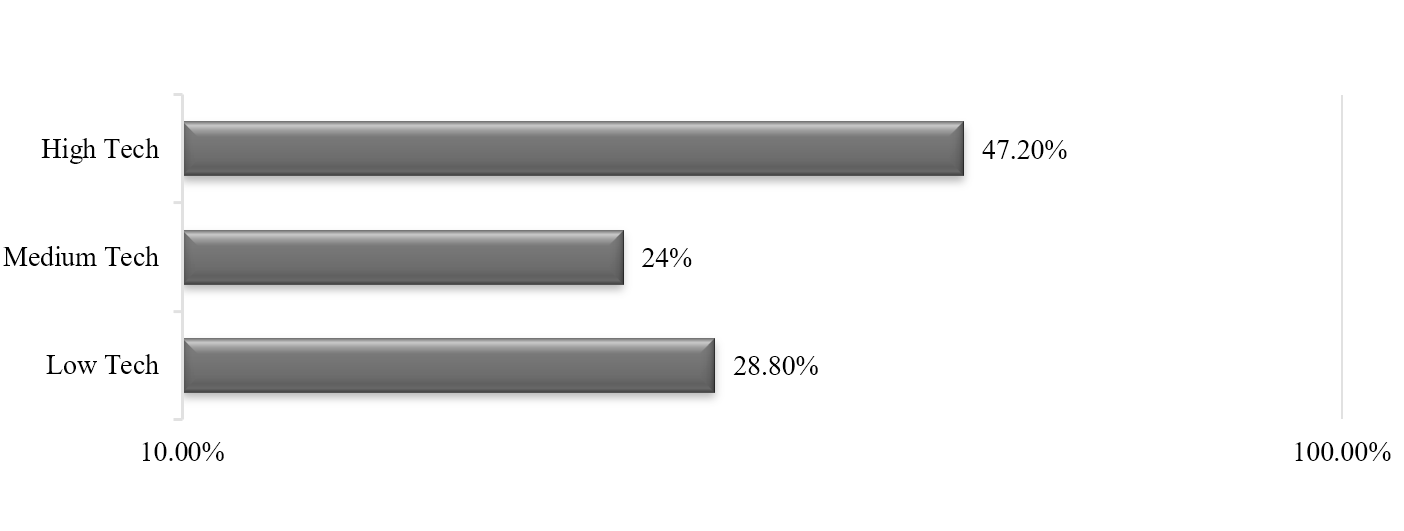
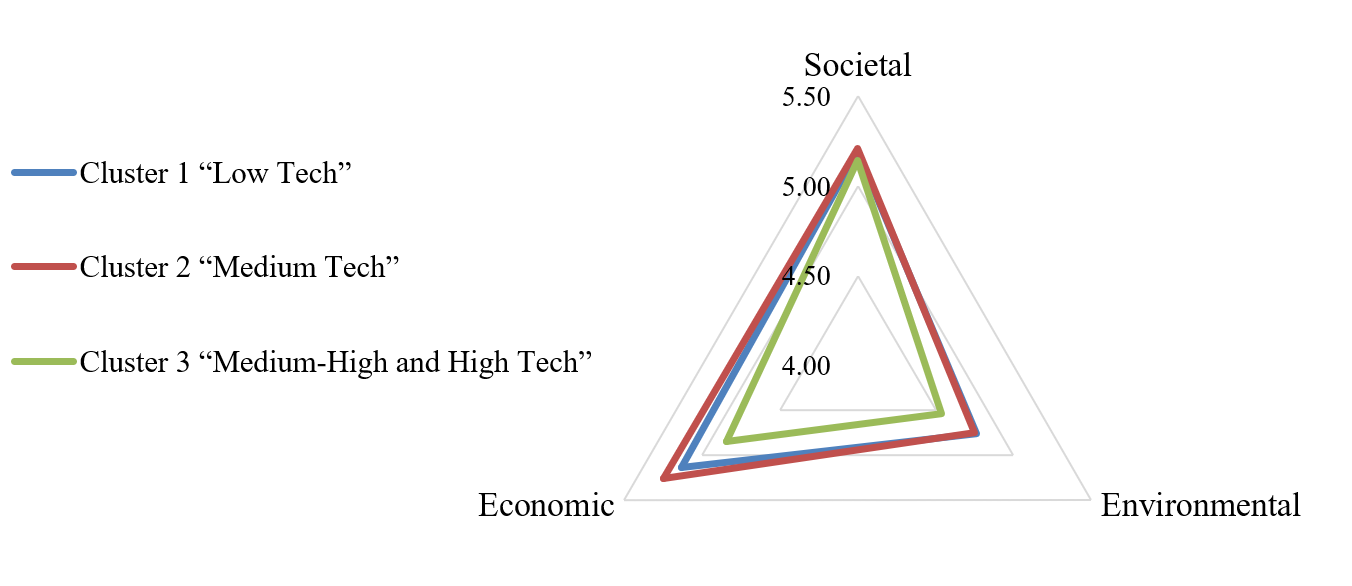
To test H2, a two-step cluster analysis was performed to group companies according to their level of technology complexity - low, medium and medium-high, and high (Galindo-Rueda & Verger, 2016) - and to see whether there are differences in the adoption rate of SI practices within and among the clusters. Cluster 1 was made up of low technology-intensive manufacturing companies (codes: 10-19, 25 and 31), cluster 2 included medium technology-intensive companies (codes: 22-24 and 32) and cluster 3 consisted of medium-high and high technology-intensive companies (codes: 20,21 and 26-30). We obtained slightly different results from the previous analysis (see Figure 6 and 7). The biggest cluster is the one made up of companies in medium-high and highly intensive technology sectors (High Tech), which again scored less in all three dimensions of SI (Figure 7). For example, they presented an average score of 4.84 for the Economic dimension. These results were further discussed with key personnel working in the implementation of SI practices from a group of manufacturing SMEs in our sample to better understand why technology intensity hinders the adoption of sustainable innovation practices. The interviews revealed that the higher level of sophistication of technology requires new skills and competences that are not easily available in the labour market, as well as new investment that top management is not always willing to make. They highlighted the need for networks and collaboration between firms and new partners to cope with the technological progress and complexity. However, a limitation to this is linked to environmental uncertainty and the level of trust in relationship building.


Discussion and implications
In recent years it has become widely recognised that firms need to develop their abilities to work with sustainability (Obal et al., 2020; Parhankangas et al., 2014; Schulte & Hallstedt, 2017) in order to achieve sustainable development and contribute to social wellbeing. By following the ‘Triple Bottom Line’ philosophy (Elkington, 1999), they are able to balance the economic, environmental and social dimensions. This need has been reinforced by the growing demand from customers and other stakeholders for sustainable innovative goods and practices and for the monitoring of companies’ sustainable performance (Weidner et al., 2020). Furthermore, the ability to constantly innovate while balancing these three aspects is also crucial in achieving firm-level competitiveness and organisational success. The question of how to reconcile environmental and economic performance has been a central topic in empirical literature involving sustainability (Ar, 2012).
This study, contributes to the sustainable innovation literature by looking at the concept of SI, which includes not just the economic and environmental elements but also a social dimension (Adams et al., 2016; Afeltra et al., 2021; Calik & Bardudeen, 2016). The topic, known as green, environmental, ecological and sustainable innovation, has been viewed as a key solution to the problem, and many studies have investigated its internal and external drivers. However, less attention has been paid to the social dimension than to economic and environmental aspects and to their consequences in terms of company performance and competitive advantage (Alerasoul, Afeltra, et al., 2022; Kneipp et al., 2019). Our study contributes to the sustainability debate by investigating the relationship between the adoption of sustainable innovations and organisational performance, taking into account the integrated relations of the three dimensions of SI, with a survey conducted among Italian businesses and semi-structured interviews. Attention is also paid to the performance of SI, through which environmental measures are adopted in traditional manufacturing companies, at the same time as examining some of the barriers such as technology intensity.
The analytical tests of the model used in the empirical stage of the study (face validation, content reliability and structural validity) revealed that the adoption of sustainable innovation practices constitutes an important positive driver of OP, with a positive impact on a company’s competitive advantage (Huang & Li, 2017). Among the three dimensions of SI, the societal aspects proved to be more relevant. Therefore, human resources management together with improvements to production processes designed to reduce the number of injuries, work-related fatalities and occupational illnesses are found to be relevant interventions in determining the quality of products and services offered by the firms and enhancing OP (Anderz & Arnetz, 2005; Bendickson et al., 2017), boosting employee productivity, while at the same time reducing absenteeism and fluctuation rates. As such, appropriate organisational policies provide an important driver to SIs and OP, supporting the important role of HRM in sustainability (Boudreau & Ramstad, 2005).
In addition, the commitment of companies to environmental issues with the adoption of more sustainable practices appears to encourage employee engagement within organisations, supporting the arguments presented by Glavas and Godwin (2013). Greater emphasis on customer satisfaction by improving the ergonomic characteristics and durability of products also appears to have a positive impact on a company’s reputation by improving customer loyalty. This further strengthens relationships with suppliers by making it clear that the company fulfils its promises in a consistent, reliable and responsible manner (Morgan & Hunt, 1994). The increase of expenditure for process innovation to provide environmental and social benefits, as well as the commercialisation of new products to obtain environmental and social benefits, appears to have a positive effect on stakeholder management. However, the level of expenditure can vary among organisations depending on their access to credit and the level of investment related to SIs, which can represent barriers to their adoption and implementation. Overall, widespread attention to employee wellbeing, customer needs, and environmental and social issues has a positive impact on employee productivity, product quality and company reputation in its relationships with customers and suppliers.
Regarding the second hypothesis, the findings revealed that Italian manufacturing companies with medium-high and highly intensive technology have consistently increased expenditure for their process innovation and commercialised new products to gain environmental and social benefits, but not as much as medium intensive and low intensive technology sectors. Manufacturing firms are continuously improving their products with innovative solutions and contribute to building a more sustainable society by also taking advantage of new technologies. Italian manufacturing firms have shown that they are able to develop and organise business networks with several stakeholders to find innovative products and solutions that impact the whole life cycle with a proper technology mix (Isaksson et al., 2018) and by adopting eco-efficiency approaches.
However, high-intensive technology companies require more significant investments to pursue environmental benefits. At an operational level, the implementation of sustainable innovations is more challenging to concretise and integrate with technical parameters (Knight & Jenkins, 2009). This result supports Knight and Jenkins (2009) findings, showing new eco-design approaches are not immediately applicable and widely adopted as they must include process-specific customisation. This is even rarer in SMEs (Schischke et al., 2006); they have fewer resources at their disposal than large companies and are likely to invest less in technological innovations to overcome existing ecological issues (Healy et al., 2015; Widya-Hasuti et al., 2018). From a direct discussion with key personnel of small firms has also emerged the lack of resources to train employees to deal with more sophisticated technology which might constitute a significant constraint as well as the difficulties of hiring employees with required competencies which seem rarely available in the labour market. Technical complexity is thus considered as one type of barrier to adopting eco-design implementation practices (Buzuku & Kässi, 2019).
In terms of managerial implications, the outcome of this study offers new insights on what resources and capabilities manufacturing firms should develop and implement to work efficiently and effectively with sustainability and achieve superior performance. By improving the understanding of SIs, companies can better allocate their resources to these innovative practices when trying to reduce their impact on the environment and ultimately improve the overall organisational performance. The findings of the current study suggested that to create more sustainable solutions and obtain a competitive advantage, businesses need to buy or develop new competencies or collaborate with other companies with the right competencies that embed sustainability 'objectives.
By assessing the importance of these innovative solutions, firms can spend a greater amount of time and energy on changing product design, developing new sustainable products, improving process efficiency and stimulating sustainable individual behaviour. By looking at the effect of adopting SIs on company performance, this study contributes to the RBV of the firm by proposing the integration of sustainability’ objectives to improve the organisational performance of firms within a long-term perspective of competitiveness.
Conclusions
This study contributes to the existing literature on sustainable development innovation and the RBV of the firm by empirically demonstrating that SI practices can have a positive impact on the organisational performance of companies. In particular a greater attention to human capital and human resources emerge as primary growth mechanisms for firm performance (Bendickson et al., 2017).
The barriers related to the adoption of SIs by small and medium companies are also highlighted and evidenced from the semi-structured interviews. Due to the level of uncertainty, more knowledge is required than for traditional innovations (Ketata et al., 2015); the level of investment needed to pursue environmental benefits can vary among organisations, as can the need for new organisational capabilities for the implementation and integration of technical parameters (Knight & Jenkins, 2009). Our findings support the argument that paying attention to stakeholders (not only shareholders but customers, employees, suppliers and society as a whole) and their interests is a critical starting point for managers and provides a foundation that drives their ongoing success (Harrison & Wicks, 2013). Finally, by “re-thinking” the business model with the integration of social, economic and environmental dimensions of sustainability, managers can improve their organisation’s efficiency and performance (Nidumolu et al., 2009; Zollo & Freeman, 2010) and achieve more sustainable long-term competitiveness while contributing to the sustainable development.
Limitations
As with all empirical studies, this research has some limitations. First, while OP was measured by several subjective indicators, the true impact of SI on performance can be evaluated more effectively by gathering a diversity of viewpoints (e.g., objective data) to overcome potential biases. Second, the low response rate means that the results are not necessarily representative of the population under examination, making it hard to generalise the results, despite their validity for the companies included in the sample. Furthermore, we only looked at Italian manufacturing companies within one time period, which means that the results may not be representative of other types of companies in different countries. This could be examined in future comparative studies, which could look at company performance in different industry sectors to allow for cross-sectional analyses, and obtain more generalisable results, as well as longitudinal studies, given the longitudinal nature of SI (Paramanathan et al., 2004). Third, environmental issues that transcend boundaries at organisational and societal levels (Clarke & Roome, 1995) require new organisational capabilities needed by the gradual change of working processes due to digitalisation. Sustainability has a significant influence on the decisions and solutions that companies generate and offer on the market (Kneipp et al., 2018); future research needs to investigate the role of new organisational capabilities, for instance dynamic capabilities, and the role of (external, internal) environmental orientation on sustainable innovation performance with regard to long-term growth and competitive advantage (Teece, 2010). Finally, to increase our understanding, using a case study approach or increasing the number of respondents from other countries could be worthwhile expansions of this study.
Future research needs
The semi-structured interviews conducted have revealed the need of more direct collaboration with the managers responsible for product development, marketing and sustainability, to get a closer look at the issues related to the transformation process towards greener products and the applicability of environmental regulations to the pursuit of sustainability. Furthermore, the relative importance of the Societal dimension in this study calls for further investigation into organizational capabilities and practices like HRM and organisational learning that can facilitate sustainable innovation practices and promote the organisational performance of companies in different contexts (Rau et al., 2020). The SDGs represent a significant yardstick for sustainability performance and adopting them requires the development or adoption of specific organisational capabilities within companies (Velasco Vizcaíno et al., 2021). Human resource management thus appears strategic to provide companies with innovative competencies by stimulating sustainable behaviours (Jabbour & Santos, 2008). Therefore, future studies might consider innovative capabilities such as organisational learning and other dynamic capabilities (Teece et al., 1997), which play a significant role in the quality of knowledge acquisition and transfer in firms (Alerasoul et al., 2021) and how these deploy and review existing resources (Martin et al., 2018) towards sustainability goals.
Finally, an investigation of the financial benefits derived from the implementation of more sustainable innovation practices can further help practitioners in their decision-making processes. Therefore, a financial comparison between sustainable innovative firms and non or lower sustainable innovative firms may help to verify whether there is a significant difference between these two groups of firms to further corroborate our findings.
