That the ability to innovate is central to the longer-term success of new firms has been long established (R. G. Cooper, 2017). Yet, while innovation is considered critical to organizational success, most new firms still struggle to innovate beyond their very first product (Belderbos et al., 2010; Radas & Bozic, 2012). For economic growth, new firms have a particularly important innovation role (Galindo-Martín et al., 2020; Gupta et al., 2013), as approximately 60% of innovations have historically come from new companies. Also, past research points to between 30 and 50 percent of all company revenue and profit are from products introduced within the 5 prior years (Griffin, 1997; Hauser et al., 2005). Both the strategy and innovation literature then conclude that the resulting new business is a major contributor to job creation (Alerasoul et al., 2022; Audretsch et al., 2009; Baumol, 2004; Marom et al., 2019).
Nevertheless, research shows a propensity for firms to only produce one product after being founded; innovation seems to stop (Belderbos et al., 2010; Radas & Bozic, 2012). A new firm’s ability to transition past this “initial product success” stage and thrive (i.e., scale with multiple products or markets) is habitually missing. This paper was designed around the important research question: if most innovation comes from new firms, and they understand that a strategy of sequential innovation is critical to their longer-term success, then why are “one hit wonders” so common?
This question is important because the new business, small business, and strategy literature have long concluded that the firms that innovate will tend to flourish, and those unable to do so will tend to decline (e.g., Rosenbusch et al., 2011; Rubera & Kirca, 2012). Yet regardless of all the academic research and industry focus on issues of innovation, the problem of follow-on innovation persists.
Literature covering the management of follow-on product innovation in small (SME) and new firms is somewhat limitebld. First, most such innovation research covers larger firms, or does not distinguish between large and small (Laforet, 2008; McAdam et al., 2004). Second, innovation research that has targeted new firms has generally studied their first product, or the antecedents to the first product (e.g., search and planning) or outcomes (e.g., market access, product success or failure) of their first product (Ledwith & O’Dwyer, 2009). Related research - on new firm failure - has covered small-firm organization structures (Terziovski, 2010), founder involvement (Wang et al., 2021), inter-firm relations (Bougrain & Haudeville, 2002) and the scarcity of technical or other employees (Bartlett & Bukvic, 2001; Romijn & Albaladejo, 2002). Financial constraints to entrepreneurial innovation have also been well-researched (e.g. García et al., 2018), but often in larger firms (e.g. intrapraneurship) and again with a focus on the initial product. Thus, scholarship on barriers to innovation and on development of first products is broad, and these literature streams have produced meaningful prescriptions for improving the odds of a successful first product development.
Underlying the rationale of these research streams is that by identifying the variables associated with failure (or success) in innovation projects, and then understanding their effect on innovation outcomes, best-practice methods and skills may be prescribed (i.e. the resource-based view or RBV). For instance, Slater et al. (2014) identified in a broad literature review those firm characteristics that relate to ongoing product innovations. Yet even with the many decades of such focused study on how to innovate and the problems to avoid, the phenomenon of anemic serial or follow-on innovation in new firms remains (Belderbos et al., 2010; Radas & Bozic, 2012). It is important to note that this paper does not study the first product of a firm.
This paper (completed in the years before Covid) aspired to build on prior research in a few ways. First is that the research focused somewhat differently on innovation stages. When studying innovation rates, researchers mostly concentrate on the earlier/planning stages – search, finance allocation, and portfolio selection – for insight into internal dynamics (Lavie & Rosenkopf, 2006; Li et al., 2008; Medcof, 2010) with an eye on any potential anemic plans for or investment in innovation. Research streams then often study the failure or success of novel products after they are introduced to the marketplace - for external insight. Less literature has focused on the development (i.e. R&D) phase to study firms overall innovation rates unless the proposition is to specifically analyze engineering skills, anemic resources, or suboptimal development processes. In other words, the R&D phase of innovation has been studied mostly to analyze how internal R&D capabilities, cultures or methods impact discrete innovation project outcomes. But any influences external to R&D, which may be causal to failures inside R&D, are mostly overlooked when explaining failure of next product delivery.
Yet R&D takes the commanding proportion of time and resources when compared to all the other phases of innovation and is central to innovation completion (Greve, 2007; Lavie et al., 2010; Medcof, 2010). It was our own field research which preceded and motivated this study, that appeared to expose the existence of a surprising level of exogenous interference which highly influenced the outcome of R&D efforts. Thus, we proposed to study the follow-on innovations attempted by early firms with already successful first products. As these new projects progressed through R&D -this outsized stage of the innovation process- we proposed using an exogeneous and a more behavioral lens to better understand what may be behind the phenomenon of “one-hit wonders”.
What makes this paper somewhat different in SME research is that it 1. proposes and tests that follow-on innovation projects (those initiated after the firms initial product) die in R&D at a higher rate than do other project types, 2. proposes behavioral theories (versus RBV) as possibly explanatory, 3. attempts to quantify any erosion from original plan by comparing these new innovation projects to non-innovation projects during R&D, and 4. quantitatively shows that external processes (unified by both resource dependence and agency theory frameworks) considerably influence the erosion of innovation.
This paper is also somewhat different in that it takes the unusual lens of not judging whether the amount of planned innovation was insufficient, nor whether any innovation was successful in the market. Instead, we only measure the extent to which the progress or outcome of these new follow-on innovation R&D projects differ in outcome from the firm’s original plans at a different rate when compared to the outcomes of all other R&D projects. In other words, it answers the questions: do new product/new innovation projects in R&D erode more (or die-off more often) when compared to all other R&D projects.
We distinguished between project types in newer firms that already have one successful product as follows:
-
An innovation project: A new product for the firm, with new technology or for new markets. These are not being developed for a specific customer and are not enhancements or derivatives of prior products and never the firms first product.
-
All other projects: Changes to the existing product that are features/enhancements, special work to existing products for existing customers/prospects, or bug fixes or updates to existing products (see Appendix 1 for specific treatments).
Research Questions
A contribution we make is in the overarching behavioral theoretical lens. Again, the development phase has been intensively studied in the innovation setting, but mostly under the context of successful versus unsuccessful R&D projects using the Resource Based View. This context is largely used to discover key competences, resources and capabilities, and to highlight recurring problems and mostly applied in larger established firms. This paper focuses on the development phase of innovation and any discernable linkage to low innovation rates in newer firms, but it focuses away from the resources and capabilities of the firm and away from R&D skills/competences. Instead, and because of our extensive preparative field work, this research focused on two more behavioral theoretical lenses for business decision processes –initiated from outside R&D- which may impact innovation projects more than other project types. Thus, we differentiated new innovation projects from the other types of development projects that an R&D group does in order to perceive any inequities.
The three research questions posed and analyzed are:
-
After the first product is introduced, is there a difference in the performance (i.e. attainment to original plan) for new follow-on innovation projects versus the attainment of other projects during the R&D stage?
-
What amount do these new innovation project outcomes differ from all other project outcomes when compared to the firm’s original development plans?
-
What processes, exogenous to R&D, might explain why differences exist in new innovation project performance when compared to other project types?
We deployed a “black box” approach to project development. This approach posits that any phenomenon of innovation that occurs inside a complex system, such as the firm, is unlikely to arise solely from within the smaller sub-system of R&D. In other words, we looked for decisions and processes that originate from outside of R&D that might explain the phenomena of project outcomes inside the R&D black box.
The study demonstrates that in firms with one successful product, new innovation success in R&D –successful completion of a new product once it has entered R&D - is 45% lower to plan when compared to the outcomes attained for all other project types. So any new follow-on product will fail to exit R&D at a rate 45% higher than will all other R&D projects. Furthermore, the shortfall is not due to project difficulty or skillset, but instead can be largely attributed to extemporary decisions to alter manpower allocations during development. We find that ongoing forces of customer power (from resource dependence theory) along with problems of agency, relentlessly re-prioritize project requests coming from existing customers and prospects and partners. Management (often unconsciously) penalizes the new innovation projects; existing and impromptu non-innovative projects are emphasized and thus crowd out their critical follow-on innovation. Innovation rates decline and no new products emerge as non-innovation work increases.
Literature
Entrepreneurship and Innovation
Entrepreneurship and innovation are closely linked (Alerasoul et al., 2022). The ability of new firms to innovate has been found crucial to success, especially in volatile markets that constantly introduce new products, or have rapidly advancing technologies and shifting competitors (Bayus et al., 2003; Tabrizi & Eisenhardt, 1995). Successful new product innovation has also been found to be a critical determinant of success, defined as growth past the small firm stage (Sharma & Lacey, 2004). Researchers have logically segmented the innovation domain -regardless of the size of firm- and examined each more closely. Camison-Zornoza and colleagues (2004) identified four commonly-used dimensions that categorize innovation research streams: “the stages of the innovation process, the level of analysis, the types of innovation, and the scope of innovation”. The innovation process dimension is usually partitioned into stages that innovations proceed through longitudinally in time. Such research includes idea search, selection, design/requirements, development (e.g. R&D which is our focus), production, and release to market (R. G. Cooper & Kleinschmidt, 1986; Knox, 2002; Rogers, 1995).
The innovation type dimension has been characterized as well, with the new ideas mostly placed on a continuum of originality from incremental to radical. Heany (1983) proposed that the minimal and least risky innovations are incremental changes to product style and at the other end of the continuum are innovations that radically influence the marketplace or create new markets or industries. Research into digital technology has more recently shown that firms improve their overall performance (measured by return on sales) when they introduce more radical product innovations (Blichfeldt & Faullant, 2021). Within these two extremes of incremental to radical are product improvements, new products for the vendors’ current market, and products for a market that is new to the vendor -these last two being the focus of this paper (e.g. Clegg et al., 2002; Von Stamm, 2003).
But innovation is a complex activity, and its measurement has been problematic (Archibugi & Pianta, 1996; Archibugi & Sirilli, 2000). At the industry level, quantitative studies usually measure innovation using two indirect variables: spending or patents. Numerous studies show that R&D expenditures, numbers of people employed in R&D, or patents have linkage to innovation (Dosi, 1988; Greve, 2003; Parthasarthy & Hammond, 2002). However, these indicators are also well known to have shortcomings. For instance, while R&D is an input to the innovation process, not all R&D is on innovation (Kleinknecht, 1989). Patents present a problem of construct validity in that they measure invention rather than innovation. Not all patents are the basis for innovations, not all are pursued, and many innovations are not patented; a propensity that differs widely by industry (Acs and Audretsch 1993; Frenkel, Shefer, Koschalzky, and Walter 2001). Our study partially addresses these research gaps/issues by proposing a more direct measurement of innovation; new innovation success as a function of accomplishment to the original plan.
Small Firm Innovation
Innovation has been studied at differing levels of analysis, from individual to industry to country, and those studies tend to apply a resource and capability (RBV) perspective. For instance, many studies have investigated R&D expenditure as being positively correlated with firm size (Acs & Audretsch, 1988, 1991; Bertschek & Entorf, 1996; Dosi, 1988; Greve, 2003; Vaona & Pianta, 2008). Tests of the (later) Schumpeterian hypothesis that large firms have positive impact on innovation has predominated these efforts. The theorized reasons for the positive relationship are that larger companies have more resources and are more likely to support risk. Literature mostly concurs that small firms often lack financial resources, have fewer competencies or absorptive capacity, and no scale economies (Ortega-Argilés et al., 2009). Though research results have supported size as a significant positive link with innovation, this conclusion has been refuted. For instance, four studies found a negative relationship between innovation and firm size, eleven were not significant, five were bell-shaped, and three were U-shaped (Becheikh et al., 2006). The relationship between R&D activities and company size is complicated by the large number of smaller firms with intensive innovative activity as in high-tech industries (Acs & Audretsch, 1993a). In addition, large firms also tend to be older than smaller firms and age of the firm has also been shown to have a positive relationship with innovation (Jung et al., 2003; Sørensen & Stuart, 2000). Our paper directly explores these still open questions by more closely examining the dynamics in play at the newer, smaller firm end of this spectrum.
Theoretical Perspectives
Customer orientation is often studied as an aspect of resource dependence theory (RDT) as it includes a firms’ dependence on customer revenue. Customer orientation is the level that an organization focuses on understanding and responding to customer needs on an ongoing basis, (Joshi, 2016), in order to create value for them persistently (Narver & Slater, 1990). Many prior studies have been done to research how a firm’s customer orientation affects innovation, but mostly in larger firms. The results have been inconsistent and show that customer orientation is either positive, insignificant, or negative in impact on innovation. Positive examples: Govindarajan et al., 2011; Salojärvi & Sainio, 2014. Insignificant examples: Atuahene-Gima 2005; Baker & Sinkula, 2007. Negative examples Gatignon & Xuereb, 1997. Christenson’s “Customer Power” (Christensen & Bower, 1996) and “tight coupling” (Danneels, 2003) posit that the more organizations need a customer’s revenues to survive, the more they are dependent on that customer. Customers gain the power to influence decisions, and will move resources away from initiatives not immediately important to them and onto improvements to products already purchased. Thus, existing customers can direct resources to their immediate needs (Christensen & Bower, 1996) and that investments to generate innovations are undermined. Customer power posits that firms are enticed or penalized away from novel projects by existing customers. The present paper addresses a significant gap in the customer power research by gathering direct data and delivering empirical results at the firm level that both quantify the effects of customer power and highlight the specific mechanisms by which customer power effects new and small firms’ ability to innovate past their first product.
Level of Analysis
This research specifically gathered evidence concerning mechanisms at the development project level, since a firm’s compendium of innovation is a summation of their successful projects. A large body of research, referred to as New Product Development (NPD) focuses on such development projects and includes topics such as how the stages of project development are sequenced, and the role of communication between departments (Frishammar, 2005). The questions pursued may inquire into either the factors affecting a firms innovation success or a project’s successful development, or on factors that affect success once the innovation enters the market. When researchers focus on NPD, it is generally through a lens of teams and skills, and structures and processes, using a firm or project level unit of analysis (e.g. Brown & Eisenhardt, 1995 for a 25-year review). For instance, innovation culture (e.g. Hasliza et. al. 2018) or the involvement of the venture’s founders (e.g. Wang et al., 2021) focused on the results of more intangible resources and capabilities while Armour and Teece (1980) focused on the benefits of cooperation between R&D and production or Benner and Tushman (2003) analyzed the drivers and types of innovation projects. These early and later studies focused on finding successful (and poor) processes, or skills and capabilities that correlate to outcomes (Bloom & Van Reenen, 2002; Brand et al., 2021; Kleinschmidt et al., 2007) and often had a goal of establishing “best practices” (Blindenbach & van den Ende 2004) or identifying issues that cause project problems (R. G. Cooper, 1995; Kahn et al., 2006). Much NPD research uses a closed system approach that studies isolated teams or R&D departments and most often in larger firms where R&D departments are large and teams are dedicated to a single project. Here, RBV-based issues such as team makeup, project processes, and team practices (Brown & Eisenhardt, 1997; Romijn & Albaladejo, 2002) that tend to lead to positive outcomes are studied. Researchers in this area have long looked to uncover specific reasons for team failures (Repenning, 2001), or how processes advised in the literature diverge from actual practice (Griffin, 1997). Theories other than RBV are still rare.
At the project level, it is R&D’s performance and not the merit of the innovation that is generally measured. Three parameters are generally used to measure performance; schedule or time, budget or cost, and quality or completeness. These three factors are at times studied individually or in combination. For instance, how a project performs relative to the original schedule is used frequently (e.g. Acur et al., 2010; Bstieler, 2005; Parry et al., 2009; and see the meta-analysis of development speed by Chen, Damanpour, & Reilly (2010) for a complete overview). While these three parameters of time, cost and quality have been theorized as in contention – as one improved, the others erode - these assumptions have not proven true (Atuahene-Gima 2003; Blindenbach-Dressesn et al. 2010). To our knowledge, no one has compared R&D performance on innovation projects versus R&D performance on non-innovation projects in the same firm as it is less aligned with an RBV perspective.
Summary
Entrepreneurship and innovation literature tends to adopt a dependent variable that measures rates of innovation or outcomes of innovation relative to other firms or other industries. This performance variable is often measured via indirect constructs such as R&D spending or patents. A firms R&D performance is largely studied at the project level, where performance is usually based on project completion or on performance to the original schedule. Such larger firm innovation perspectives generally embody a few core assumptions: increased innovation is positively linked to firm performance; innovation is an optimal use of R&D resources; innovation can be linked to specific resources and capabilities; and these R&C’s can be used to formulate “best practices”. Innovation research under these assumptions then looks for positive antecedents to the chosen DV. In other words, it looks for antecedents to high levels of patents, high R&D spending rates, project completion or projects that have market success and focus mostly on larger firms. None of these constructs, however, are direct measurements of innovation.
The context of most project-level development research focuses on sequential development in a predominantly closed system approach. Analysis is of issues surrounding a single artifact, or issues associated with one team with responsibility for development. When management processes are considered, the predominant paradigm is again a closed system that analyzes the internal support of the one artifact or team. While innovation research has a history spanning back 100 years, over the last few decades scholars have mostly adopted a resource-based (RBV) perspective in larger firms with the goal of identifying the conditions (resources and capabilities) under which innovation succeeds or emerges at a higher rate.
Hypotheses
In our research we applied entrepreneurship, innovation, and NPD literature with regard to development stages and development processes to hypothesize relationships between the DV of project performance to plan and the IV constructs derived from our own field-derived theoretical underpinnings from Agency and Resource Dependence. Our field work was initiated from an interest in actions and activities exogenous to R&D, that might have significant impact on perceived R&D performance. As such, our scope of potential IV’s was self-limited.
Our models hypothesized (and then we tested) that changes are made to innovation project resources during the development phase due to exogenous behavioral -based theoretical constructs:
-
Resource Dependencies: decisions are made that change development manpower due to dependence on customer revenue and investor capital.
-
Agency Effects: decisions are made that change development manpower due to opportunism from agents in Sales and bonding behavior of the CEO with investors.
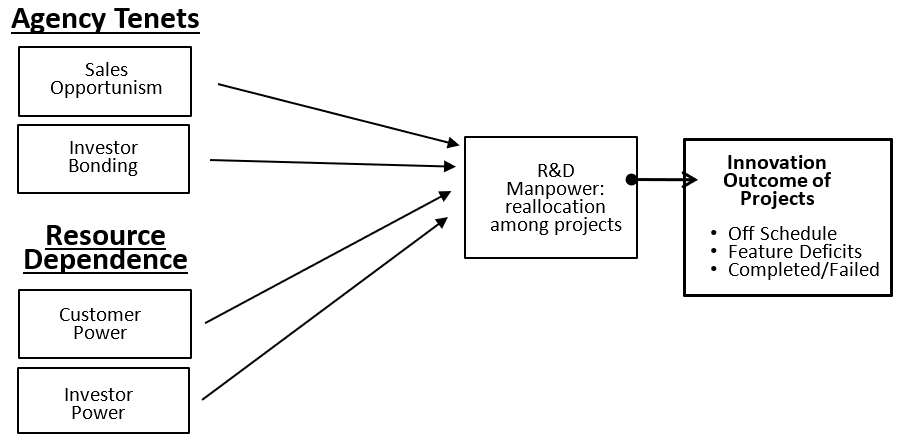
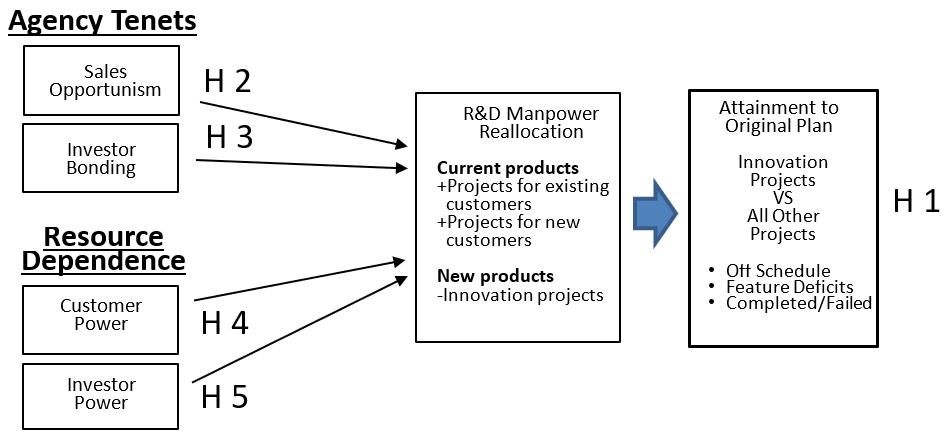
These theoretical constructs which originate outside of R&D are strongly linked. Sales opportunism is related to customer power, while capital dependence is related to CEO bonding. Figure 1 organizes a single explanatory model; two tenets are from Agency Theory (Bonding and Opportunism) and two are from Resource Dependence Theory (Revenue and Capital Dependence). The paper then tests each of these four framings as individual models separately, and then testing is done in combination.

The Basis for Resource Dependence Theory
The argument for why resource dependence can affect innovation projects is based on revenue dependence or “customer power” (Christensen & Bower, 1996), and on capital dependence or “investor power”. Because a firm needs revenues for survival it is dependent on its customers. This dependence, especially for newer or smaller firms, delivers to certain customers the power to influence the firm’s decisions. The argument, similar to customer orientation, is that customers will use this power to cause a reallocation of resources onto projects that address their own immediate needs (Joshi, 2016). Innovations, having longer term or inapplicable (to the specific customer) or unclear future benefits, tend to be undermined.
Another vital resource for a newer firm is capital. Capital dependence theory (Boies & Prechel, 2002; Prechel & Boies, 1998; Stearns, 1986) posits that a reliance on equity financing empowers investors, who own a significant portion of the firm to influence management decisions (Prechel & Morris, 2010) toward improving stock value. Because a new firm may likely need future equity investments, existing investors who will provide future funding have power to influence the firm’s internal decisions. The argument is that investors use this power to reallocate resources onto projects that they deem will most increase the value of their existing equity investment.
Customer power variables tested the extent that any customer might influence and change ongoing R&D resource allocations in new firms. This included size of order needed to influence a change, customer concentration (degree that firm revenue is from a few customers), and how important landing a referenceable customer is to future revenue.
Investor power variables tested the extent that a company’s investors might influence R&D changes. This included the impact of needing future equity investments, and their investors assignment of importance to winning prestigious accounts, winning large orders, or gaining well-known partners in an effort to increase valuation.
The Basis for Agency Theory
Our conjecture that Agency tenets can affect innovation projects was based on arguments that go back as far as Jensen and Meckling (1976) who described Agency Costs (e.g. any sub-optimal outcomes) and specified that they are incurred from agents’ decisions of self-interest that diverge from the principal’s interest. These costs are inherent and unavoidable in any delegation (Fama & Jensen, 1983; Jensen & Meckling, 1976).
We tested for the agency tenet of opportunism and its influence on R&D changes. Opportunism by sales people was measured by 1. goal mis-alignment – the extent that agents (in the Sales Department) have divergent self-interest from the firm; 2. asymmetric information – the level of Sales’ superior information regarding customers and orders; and 3. the level of guile - how misleading is this agent willing to be. While most Agency Theory research has focused on the CEO, for decades research has also shown that the problems of agency exist in any matter of delegation, and whenever incentives exist for agents to increase their personal return (A. C. Cooper & Dunkelberg, 1986)
Agency Bonding was also tested for its impact on R&D. Bonding activity describes CEOs actions made to demonstrate alignment with the goals of the major investors in the new firm, Bonding was measured based on changes made to R&D intended only as a signal to the investors. These measures were changing R&D in order to meet the revenue targets promised to the investors, or to land a prestigious account, or a very large account specifically as a signal to the investors. Bonding posits that, especially in new firms, management will take suboptimal courses of action in an attempt to persuade principals that they are indeed acting in their interest (foundational work includes Barney & Hesterly, 1999; Jensen & Meckling, 1976).
Development manpower allocation is shown in the model for explanatory purposes. The independent variables are construed to cause management decisions on resources which impact underway R&D projects. For instance, new projects can be added to the existing development plan, or changes made in scheduling due to shifting urgencies. Given that total manpower available does not rise in the short term, especially at smaller firms, any additions or changes affect projects in progress as well as impact the planned start dates for other projects. Our dependent variable – a comparison of innovation project attainment versus all other projects – is thus affected by the full moderator of any addition or reprioritization of projects. Any new work or any changes must, by definition, affect the fixed manpower pool, which must –in turn- impact existing projects.
The hypothesis is that Resource Dependence or Agency driven changes impact innovation projects differently than they impact all other project types. Change in manpower or the addition of new projects or a change in priorities is hypothesized to predominantly pull resources from innovation projects. For instance, as customers, partners and prospects request product changes, the manpower is conjectured to move by necessity from existing projects. But the movement is not uniform. This paper proposed and then tested the proposition that the re-allocation of manpower is accomplished mostly by shifting manpower away from innovation projects in new firms. The new projects and changes added to the compendium of R&D work were mostly done to please existing and large customers for work on existing products.
Our hypothesis is that innovation, as measured, would be reduced relative to all other development. First, the projects added to development are predominantly current customer demands and for current product changes. Second, whenever manpower is shifted to meet these demands it is first taken from projects with less critical deadlines. Thus, the output of innovation is hypothesized to deteriorate from plan, in favor of other project types. This performance impact (the DV of a change in innovation) is measured by the variance in project time (adherence to schedule), project quality (completeness to planned feature set) and the amount of work undertaken to completion (total projects).

Hypothesis 1: Development manpower reallocates as customer-oriented projects are added to R&D. Resources decline for innovation significantly more than for other projects.
Plans for resource allocation tend to change. Hypothesis one is that new projects earmarked to enhance short term customer revenue are prioritized into the R&D plan. As a result, innovation projects (measured by schedule adherence, feature completeness, projects undertaken) will tend to significantly decline more than other project types.
Hypothesis 2: Agency opportunism will have an outsized measurable and negative effect on the resources dedicated to innovation.
Sales agents are incented by self-interest to change the development plan. Asymmetric information, goal incongruence, and willingness to mislead (as measured by exaggerations in the timing, size, and importance of projects), will mean the addition of new projects/new priorities to R&D. These projects will be linked to a decline in innovation. Hypothesis two is that sales opportunism is explanatory for the decline hypothesized in H1.
Hypothesis 3: Agency bonding will have an outsized measurable and negative effect on the resources dedicated to innovation.
CEO will act to change the development plan in order to signal alignment with investors. Manpower will shift to support any CEO promises, revenue targets, or prestigious accounts that signal alignment with investors. These projects or priority changes will be linked to a decline in innovation. Hypothesis three is that bonding behavior is explanatory for the decline hypothesized in H1.
Hypothesis 4: Resource Dependence on revenue will have an outsized measurable and negative effect on the resources dedicated to innovation.
Customer power influences new projects to be added to the current product development plan when required for unusually large orders, to win important reference accounts, or to meet demands from the firms’ largest customers. These projects will be linked to a decline in innovation. Hypothesis four is that customer power is explanatory for the decline hypothesized in H1.
Hypothesis 5: Resource Dependence on capital will have an outsized measurable and negative effect on the resources dedicated to innovation.
Projects will be added to the development plan when tied to a marquee account or large orders because investors demand results that increase short term valuation, or they have a positive effect in any impending need to raise equity capital. Again, these projects will be linked to a decline in innovation. Hypothesis five is that investor power is explanatory for the decline hypothesized in H1.
Methods
This papers research followed-up on a prior research effort; an extensive field study including interviews with 22 CEO’s and R&D managers at ten recent software ventures. While not included in the results or methods of this paper, a short history of the genesis of the ideas tested here is in order. The interviews occurred over 6 months at newer software ventures in the Boston area, all with revenue from existing products. They were open ended and each lasted for up to an hour, but with questions that were directly related to uncovering any issues that might be hindering the organizations efforts to develop new products, using theory building process (e.g. Alvesson & Kärreman, 2007; Eisenhardt, 1989; Eisenhardt & Graebner, 2007). NVivo text analysis software was used for independent researchers to code the interview data and then to transform the interviews into a cross comparison and extract core concepts. The result of the field work was first, the postulated DV of innovation project erosion compared to non-innovation projects and second, the idea that the surprising (to us) underlying behavioral theoretical framework for customer power and Agency theory should be tested. Thus, a qualitative phase directly informed the design of this papers quantitative large-scale data gathering.
The methodology subsequently employed for this paper is somewhat distinctive. 1. It is a population census, which 2. examined every newer US-based SME software firm that already had one successful product. This method of analyzing an entire population is free from the statistical problems of sampling. Thus, the research of this paper is based on data gathered from the entire population of newer software firms which had already delivered one successful product to market. Specifically chosen was the prepackaged non-consumer software industry; newer ventures less than 6 years old was the frame of interest, but with a product that is already commercially available and with revenue. To reflect our title, startups yet to deliver a first product as well as older firms, were purposely excluded. A non-consumer software product would include a very broad set of applications, software tools and infrastructure items such as; databases, artificial intelligence, analytics and design applications, security infrastructure, communications and networking infrastructure, financial services and accounting, supply chain and production.
This frame was chosen for numerous reasons. Variations in R&D investment rate have long been linked to industry sector when (1) rate of technological change, (2) the growth in demand, and (3) industry structure have been modeled. Studies (e.g. Evangelista et al., 1997; Kalantaridis & Pheby, 1999) have found that more technology intensive industries, such as software and pharmaceuticals, are in fact more innovative. The reasons given have been broad. For instance, established industry sectors tend to have lower R&D expenditures when compared to newer ones. The results of the many studies have produced groupings of industries according to innovation rates (Acs & Audretsch, 1993b; Frenkel et al., 2001). Lavie & Rosenkopf (2006) followed innovation in a sample of 337 software firms over eleven years. They found unique complexity due to the small size of the development teams; small firms have developers work on multiple projects simultaneously with all development needs and projects of the organization handled by the same small pool of engineers. Large firms with isolated projects (an engineering team dedicated to one project) are also out of the scope of this research. Furthermore, while very small firms (1-8 total employees) represent a significant portion of these software enterprises, they were omitted from the study since the existence of a distinct R&D department was fundamental and single-developer organizations would be idiosyncratic by definition.
Software was chosen because of the innovation intensity of the industry and the sheer number of newer firms. The top five most research-intensive industries are medical chemicals (SIC 2833); biologic products (SIC 2836); packaged software (SIC 7372); diagnostic equipment, (SIC 2835); and communications apparatus (SIC 3661). In addition, software was chosen in order to limit the impact of external supplier dependencies. The reasoning is that software is knowledge work internal to the firm. Externalities – project performance problems due to external dependencies - make it harder to isolate organizational issues. Also, software companies exist in a market setting that economic and competitive theory suggests would force them to produce advantage via innovation and high levels of service (Porter, 1998). Last, we chose firms with significant revenue from already existing software products, intentionally omitting those firms still developing their first product, because it was the issue of producing a second product that was the point of interest. We did not investigate locations of the firms so no proximities to universities, technology industry clusters, or capital sources were considered.
The study was based on data from a large-scale mail questionnaire, because mail has been found to have significantly higher response rates than web questionnaire for the age and business profile of the target subjects. The methodology followed the Tailored Design Method as outlined by Dillman (2014). This quantitative phase was a population study. It is referred to as a census (versus a survey) since every firm was sent a questionnaire and followed up on. There was no sampling.
To ensure that the population was accurate, the Standard Industrial Code was crossed checked with US Census information and with lists (we used) as available from Dunn and Bradstreet (D&B). All was done to ensure we had the correct and entire set of all software firms in the chosen population. Both the United States Census and D&B are often used in business research.
Preparation for the questionnaire occurred in phases. Based on prior research, questions were fashioned to operationalize the variables. The questions were then tested in sequential sessions, where subjects were observed completing the questionnaire. They were then prompted to ask questions, and raise concerns, followed by semi-structured interviews to include tests of wording suitability and clarifications.
Our goal was to understand the failure to produce follow-on products. As a method of establishing a new venture as an ongoing concern with revenue from existing product, a minimum revenue hurdle of $500,000 a year was set. The benchmarks resulted in a population of 944 companies. Next, the database was searched to exclude consumer firms, custom developers, and firms no longer in business or acquired. A final count of 826 companies constituted our entire population of study, and the questionnaire was then sent to this entire population. In total, 168 questionnaires were returned for a response rate over 20%. There was no discernable difference in the population profile who were sent a questionnaire with the respondent profile.
Bias and Error
Since our method is a census (questionnaire sent to every firm; the entire population), there are no undercoverage or confidence-level issues related to surveys, sampling, and sample size. We analyzed for response bias by the normal method of comparing profiles of respondents over time (late versus early) and location and found homogeneity.
Common Methods (CMV). CMV is caused by measurement approach, and not the constructs of interest. Our testing showed it was not an issue. The technique used to gather data introduces CMV and was addressed by not having linked questions so that relationships between constructs are not entangled, and because this study’s questionnaire did not measure linked factors. In order to rule out nonresponse bias, the early respondents were compared with the latest and no significant differences were found. It would have meant that the individuals not responding must somehow be at firms that are different from the responders. Our census was homogenous.
The analysis for our data and Likert items involved exploratory analysis (SPSS factor analysis, Varimax rotation) to measure support for combining individual Likert scales into variables. Then, factor analysis was again employed on variables which all loaded significantly and on one factor. Our data was found to be normal in its Gaussian distribution to result in low regression prediction error.
Analysis & Results
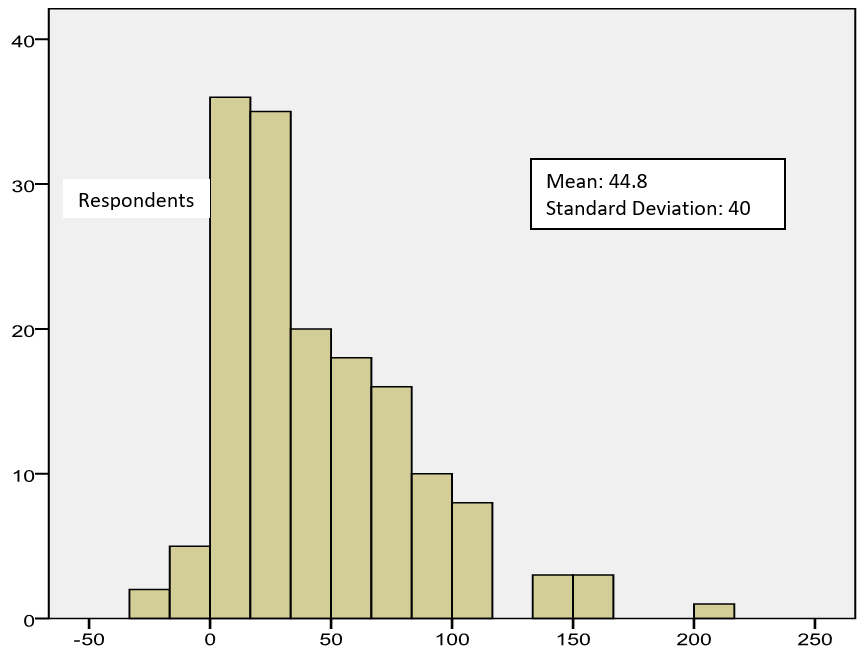
Dependent Variable. Result: the average divergence between innovation and all other projects was 45%.
The dependent variable was designed to indicate the extent and pattern of any resource shifting during the project development phase. It expresses a relative change in performance by measuring the performance of innovation projects and comparing it to “all other” projects. An innovation project was defined as any new projects/new products not for an existing customer and not an “add-on” to an existing product. Project performance is a composite measure of the three generally used constructs in R&D: amount that R&D manpower changes versus the planned level; project feature list completed compared to original plan; and project schedule performance compared to original plan. The Dependent Variable is then interpreted as a single construct: the difference between the original project plans and the actual results. Then, we compare this difference in performance for the innovation projects with the performance of “all other” project types. This performance difference is our DV. Hypothesis 1 is that a divergence in the direction away from innovation projects would be observed.
This DV is critical in that that it shows what happens to the plan for innovation, versus what happens to the plans for “all other” projects in new firms. The results are noteworthy. Table 1 and Figure 3 show that while one-third of respondents report that their innovation decline is less than 20%, the average reported decline in innovation projects versus all other projects is in the 45% range. In fact, a full 40% of respondents claim that the gap or disparity exceeds 45%. Again, it should be noted that all of the disparity (erosion in innovation) occurs after R&D’s plans were set and development had begun.

Based on this analysis, Hypothesis 1 is supported; development plans do shift and innovation projects significantly weaken when compared to “all other” projects performance during the development phase.
Independent Variables
The independent variables are outlined in Table 3. Questions were fashioned to express a tenet of either Agency Theory or Resource Dependence Theory. Once the reliability, factor analysis, and descriptive statistics were completed (Table 2), a series of various linear, multivariate, and stepwise regressions with ANOVA calculations were done (Table 3). This section reviews the regressions for four relationships (Sales Opportunism and CEO Bonding, Customer Power and Investor Power) to show the extent to which any shift of resources was related to the model.
Hypothesis 2 specifies a positive relationship between stronger sales force opportunism and a shift away from innovation. In Hypothesis 3, a relationship between customer power and a decline in innovation is indicated. Hypothesis 4 is that the CEO bonding behavior to the board of directors is a significant predictor of the DV. I also draw from literature on capital dependencies and argue that certain capital needs negatively impact innovation. Thus, Hypothesis 5 predicts that investor power is positively correlated to a shift in the DV. Each model, therefore, predicts that as the IV’s increase, the DV will shift away from innovation.
Regression 1: Sales Opportunism
The analytic strategy for the sales opportunism model (H2) involved three variables. Two were created by combining Likert scale items, and one was a combination of ratio comparisons. The regression for model one was conducted with three Opportunism IV’s; Sales Intent to mislead, Goal incongruence, Asymmetric Information against the dependent variable (change in innovation plan).
As shown in Table 3, the adjusted R square was strong at 0.51, and the overall model significance was 0.000. The regression produced considerable results for each individual variable’s coefficient, and each was significant. These results show strong support for Hypothesis 2 that Agency opportunism has a negative effect (~50%) on small firm innovation weakness. The overall model is strong, and each IV is interpretable.
Regression 2: CEO Bonding
The CEO Bonding regression, analyzed the three independent bonding behavior variables against the same dependent variable as model one.
The adjusted R2 is 0.25, and the model is significant to 0.000. These results show support for Hypothesis 3 that CEO Bonding has a negative effect on small firm ability to innovate. The model is significant. Strength is especially high for IV 1 and 2.
Regression 3: Customer Power
Regression three was of the three revenue dependence variables. The adjusted R square was 0.21 with significance. The regression model produced noteworthy results for each individual variable’s coefficient, and each was significant. These results show support for Hypothesis 4 that Customer Power has a negative effect on innovation.
Regression 4: Investor Power
The investor power regression analyzed four independent variables. The resulting adjusted R2 for the model is low at 0.07, and the model is significant to 0.04.
C2.3 and 4 have significance at or below 0.05 and show mixed support. The model has a low R2, so each IV must be interpreted with care.
Regression 5: Combined all Theoretical Models
The intent of Model Five is to analyze all variables, spanning the four theorized relationships. The goal is to discern which independent variables are the most significant. In this complete cross-theory model regression, Adjusted R2 is 0.51, and the model is significant to 0.000 which is strong. The variables from sales opportunism and customer power are the most predictive, while CEO bonding and investor power are relatively weaker.
Discussion and Implications
Although research on new ventures and finding the antecedents to strong innovation and new product performance has spanned many decades, failure is still reported with oversized regularity. Researchers have studied innovation deficits in such firms most-often with a predisposition that either innovation plans are too low, or resources are too inadequate, or engineering skills are too weak. Also, inadequate manager attention, a weak innovation culture, or restrictions to market access have been studied. The research of our paper adds to extant scholarship by finding strong support for the precepts of agency dynamics and resource dependence as significantly reducing innovation. These are classic strategy-related forces affecting the longer-term outlook of newer and smaller firms. This paper supports the overarching findings of prior research that innovation projects generally do have more delay, more feature deficiencies, higher cancellations, and more frequent interruptions while in R&D than do other projects in new ventures, but the addition is that it links these outcomes to theories unrelated to capabilities.
Innovation remains below what scholarship indicates is optimal (Belderbos et al., 2010). The past few decades of research held out the promise that by applying best practice for planning, for search and portfolio selection, as well as by honing development skills, the strategic outcome of strong innovation would follow (Medcof, 2010). The far-reaching literature on product development practices - especially resources and capabilities-based research - gave hope that advances highlighted in the literature might be used to improve innovativeness. Antecedent skills required in the development department, or characteristics of project leaders, teams and even senior executives seemed to hold the keys to better, ever-improving outcomes (Greve, 2007; Lavie et al., 2010). Yet, the existence of the low innovation in small new firms has persisted. Little improvement seems to have been made, and the intractability has a doggedness that has been virtually inexplicable (Belderbos et al., 2010).
Implications for Theory
Strangely, two of the most powerful and accepted organizational and strategy theories - Agency and RDT - have been missing in the research on this problem. Therefore, the most important insight of this paper is the idea that alternatives to RBV may be of assistance; decisions based on human dynamics that originate outside the firm and outside the R&D department influence innovation outcomes by shifting manpower.
Important evidence for our research questions is that the shifting of resources away from follow-on innovation during the development stage in newer SME’s is substantial (45%), and the shifting is a regular, ongoing phenomenon. Furthermore, these follow-on innovation projects have markedly worse outcomes than other project types and that those firms with higher sales opportunism, CEO Bonding, and resource dependencies show less such innovation than firms that do not.
These conclusions may differ from other streams on innovation, but certainly do not refute them. One is that low innovation is largely determined by the planning stages of strategy and development. (e.g. Ahuja & Katila, 2004; Lavie et al., 2010). The other is that the root causes of innovation diminution after planning can be found in resources and capabilities of the firm’s R&D group, or the infrastructure that supports R&D (Brown & Eisenhardt, 1997). This study does not reject these issues, it merely introduces other important factors.
Practical Implications
Apart from the theoretical implications already discussed, there are practical implications for management. Most managers interviewed at the discovery phase of this investigation were well aware that their more innovative projects were systemically impaired. They were also aware that strategically, successful innovation was critical to their firm’s future. Nevertheless, they did not have a solid understanding of why innovation was anemic. The findings of this quantitative study are especially didactic for managers concerned with innovation in that it provides data to inform on the how. This research shows the pathways of compromise so that managers can plan appropriately and be “on guard”. The implication is that whenever new requests for engineering resources arise, managers must first understand the inevitability of resources and priority changes to all planned projects.
Specifically, the mechanisms of innovation decline are both predictable and important to understand for all managers outside of the Sales Department. CEO’s and R&D Managers must especially be vigilant in understanding the ultimate outcome of the constant stream of new project requests, no matter how small.
Our research shows that even though the barrage of field-based requests for changes and additions that inevitably enter the firm can be exceedingly frequent, they are surprisingly perceived as unprecedented and unforeseeable by management. Unless managers understand this phenomenon and also understand the ultimate longer-term strategic affect effect of responding positively to these requests, the dilemma of innovation failure can not be resolved.
The underlying issues may be many-fold in some relational order. One possibility is a seemingly lack of understanding by managers as to the degree that diversions of resources onto bespoke projects has on killing future innovation. Another is the possible lack of understanding about the degree to which “self-interest with guile” can actually be the driving force behind Sales people’s desire to change R&D resource allocations. Yet another is the potential that managers may willingly trade the avoidance of a short-term setback (i.e. in revenue) or of winning a short-term victory (e.g. landing a new account) for their strategic goal of longer-term survival and growth. By betraying their critical -and more important - longer term plan for innovation in order to win an immediate feather in their cap, they lose the longer-term success.
Limitations
This quantitative research was limited to newer and smaller software design firms. Therefore, it is not proposed that it is broadly generalizable. Furthermore, the measurements we have used for the different aspects of agency, resource dependence, and innovation performance are perceptual, since they are all self-reported. The study relied solely on self-reporting with questionnaire-based measures, even with the understanding of the inherent potential for bias. The reason is that it is unworkable to obtain objective measures (such as inspecting individual and longitudinal Gantt or Pert charts from hundreds or thousands of firms) for the constructs used in this research across many hundreds of firms.
The IV constructs were first perceived and then defined based on our own field work which concluded before the census was done. But the field work was first initiated from an interest in understanding actions and activities exogenous to R&D, that might have significant impact on the performance of R&D on projects already underway. As such, our scope of potential IV’s was self-limited. We did not study, for instance, skill sets.
The measures we used are a partial representation of all the possible measures for the variables we operationalized. It is very possible that other, potentially important or more powerful measures, were overlooked. While prior research was examined for guidance, it was found to be generally limited in the use of these exogenous constructs. Nevertheless, scholars and experts may exist who could posit better operationalizations than we constructed.
As a mail questionnaire, our data came from the vantage point of those who decided to be respondents. It is always better if the response rate is higher or if multiple respondents from each firm could be done, but again it was found to be unworkable given the database availability, range, and robustness for our chosen population, plus our other resource limitations.
Future Research
For theory, the limitations that were found in applying Resource Dependence Theory and Agency Theory raise the need to validate and refine the use of these well-established theories at lower levels of the firm, and on innovation. It would also be interesting to expand the research beyond early software firms to gauge the impact of these variables on other firm types and it would be helpful if researchers with grounding in Agency and Resource Dependence could expand on the definitions and use of the variables.
Another promising avenue of study would be to investigate “whys”. Why do some firms respond to the variables uncovered in the models more than others? For instance, some respondents reported strong revenue dependence, but did not shift resources to the degree others did. In addition, some firms report higher degrees of Agency dynamics such as more opportunism in their sales force - more intent to mislead in order to shift development priorities. In a similar vein, an unanswered issue is why some firms are more susceptible to such opportunism, and show an increased willingness to shift resources. Moreover, we did not specifically analyze specific locations of the firms for potential mitigating factors. Could those firms with proximity to universities, tech industry clusters, or capital sources have differing performance than those that do not?
An underlying question, important to strategy research and a potentially rich area for further research, is a “so what” question. Firms may shift resources during development, but which firms have better performance: shifters of non-shifters? We should not assume that shifting of resources away from innovation is the wrong choice; we cannot say that it constitutes a problem.
The next logical step would be to compare self-reported evidence with actual changes in development schedules. The R&D schedule, as it changes over time, could be analyzed to compare the first schedules that are created to address the firm’s original plan, with the final, or post mortem schedules that are ultimately recorded as engineering managers move resources.
It would also be interesting to explore who is involved in the decisions to shift resources. For instance, the levels at which the decisions are made is unclear. The CEO, project leaders, VP Development., for instance are all aware that changes occur, but where the decision points rest is unclear. How does the participant profile differ depending on size of the shift required (impact on innovation projects) versus the size of the opportunity (impact on revenue, or goal misalignment, or bonding, or capital)?
Conclusion
The results of this research are intended to assist with strategic decisions concerning new product innovations. It was restricted to innovation within the R&D phase in smaller and newer firms. The study compared relative performance of new (innovation) product projects to their original plan with the performance of all other R&D projects to their original plan. The research supports the overall hypothesis that resources systematically shift away from innovation even in newer and smaller firms, and it also suggests the mechanisms that antecede this outcome. Management literature contains many studies that focus on innovation at the project, team, and firm level - looking both at the foundations of failure as well as success. But links between Agency Theory and Resource Dependencies on the phenomenon of low innovation have not been established. We address this gap in the customer power research (part of RDT) by gathering direct data and delivering empirical results at the firm level that both quantify the effects of customer power and highlight the specific mechanisms by which customer power effects new and small firms’ ability to innovate. The results of our study show that it is more likely to find a firm with a relatively high level of such resource shifting when sales opportunism is high and resource dependencies are large. The resulting failures of innovation in firms, which this paper quantifies, is in line with what the tenets agency theory and resource dependence theory would predict.