Introduction
Small businesses contribute greatly to economies around the world (Halabi et al., 2010), generating jobs, functional products, tax revenues, and charitable donations (Chaganti et al., 2015). By some estimates, SMEs account for 70% of global production (Bak et al., 2020). Additionally, entrepreneurial small businesses capture market opportunities, develop product niches, and leverage new technological developments (Pinho & de Sá, 2013). Supply chain management (SCM) is an important business leadership element, providing a potential competitive advantage; SMEs are no exception (Wu et al., 2006). Given small firms’ prevalence and importance, researchers should seek to provide small business leaders guidance as to effective supply-chain management approaches.
However, supply chain research has mainly focused on large organizations; this is particularly true for the concepts of sensing and agility (e.g., Aslam et al., 2018; Bharadwaj & Dong, 2014; Eckstein et al., 2015; Manzoor et al., 2022). A relatively small amount of SME literature has focused on how firms detect changes in the marketplace (sensing) and adjust to those changes (agility); for a complete review, see Bak et al. (2020). According to Jayaram, Dixit, and Motwani (2014), SMEs typically have fewer SCM capabilities compared to their larger counterparts. However, their smaller size may lead to other benefits, such as flexibility and nimble responses (Bak et al., 2020; Polyviou et al., 2019). Therefore, we seek to address the following research questions:
RQ1: Does supply chain sensing – which is analyzing the supply chain environment – enhance firm performance in SMEs?
RQ2: Does supply chain agility – which is the ability to adapt quickly to supply chain environment changes – enhance firm performance in SMEs?
RQ3: When small business leaders engage in both supply chain sensing and supply chain agility simultaneously – referred to as dynamic sensing and agility capability – does that further enhance firm performance?
RQ4: Does the supply chain dynamic sensing and agility reduce the impact of supply chain constraints that affect SMEs?
Given small businesses’ limited resources (Becherer & Helms, 2016; Cordeiro, 2013), we see a benefit in expanding small business research on sensing and agility. Knowledge drawn from this research may help small business leaders effectively and efficiently apply their finite resources to manage supply chains better and develop a competitive advantage. We organize this paper as follows: first, we detail relevant literature; then, we describe the survey methodology utilized; next, we develop our hypotheses; subsequently, we detail the methods used for data analysis, including EFA and PLS-SEM; finally, we discuss our findings and make our managerial recommendations.
Literature Review
Over the last 20 years, the “sensing” and “agility” concepts have grown in recognition as critical supply chain management capabilities (Aslam et al., 2018). Motivated to manage uncertainties while being responsive, innovative, and meeting customer needs, firms developed capabilities to recognize changing conditions and adapt rapidly to meet the new environment criteria (Alkurdi & Vázquez-Bustelo, 2021; Gligor, 2014). Perceiving environment changes (market sensing) and responding to these changes quickly (supply chain agility) are positioned as dynamic capabilities which are critical to competitiveness (Aslam et al., 2018). In exploring effective small business supply chain management, we applied supply chain sensing (SCS) and supply chain agility (SCA) together as a higher-order construct, a dynamic sensing and agility capability. Below, we discuss those three constructs. In addition, we review the literature relating SMEs and dynamic capabilities.
Supply Chain Sensing
Supply chain sensing (SCS) represents a firm’s ability to detect dynamic changes in customer and supplier market environments. Firms that possess this ability can create a competitive advantage (DeGroote & Marx, 2013). Most supply chain scholars have combined SCS with aspects of SCA; generally referring to these concepts together as SCA. While Alkurdi and Vázquez-Bustelo (2021) include sensing as part of SCA, Aslam et al. (2018) posit that market sensing is an antecedent of agility and, therefore, a separate capability. Aslam et al. (2018) argue that firms could not provide supply chain responses without sensing the opportunities and threats in the first place. Morgan (2012) likewise separates market sensing as tasks that seek to understand market conditions through scanning customers, supply chain partners, and the general environment. This view is supported through the lens of dynamic capabilities, suggesting that market-sensing abilities are prerequisites of other dynamic capabilities (Aslam et al., 2018; Teece et al., 2016).
Supply Chain Agility
Supply chain agility (SCA) represents a firm’s ability to respond quickly to short-term changes in demand or the environment (Aslam et al., 2018) – assuming the firm has the capability to sense the changes (Eckstein et al., 2015). The concept of agility has recently received significant attention from academics, evidenced by multiple comprehensive, structured literature reviews focused on SCA development measurement of (e.g., Alkurdi & Vázquez-Bustelo, 2021; Du et al., 2021; Fayezi et al., 2017). A prevailing view of SCA includes common defining themes: sensing, flexibility, speed, and alertness (Alkurdi & Vázquez-Bustelo, 2021). These authors included both proactive and reactive items to measure SCA. “Proactive” items “are concerned with the supply side of the supply chain and centered on detecting changes in the market and harmonizing operational capabilities” (Alkurdi & Vázquez-Bustelo, 2021, p. 15). “Reactive” items “are related to practices that act as defensive mechanisms that enable the supply chain to respond to events after they have happened” (Alkurdi & Vázquez-Bustelo, 2021, p. 15). This view of agility has much overlap with that of Gligor et al. (2013), who posit that agility includes the proactive aspects of alertness and accessibility, along with the reactive aspects of decisiveness, swiftness, and flexibility.
Sensing market condition changes that impact strategy and the ability of a company to take action rapidly to respond to the changing market conditions have been shown to be important criteria for leaders to prevent business models from falling behind (Doz & Kosonen, 2008, 2010). These authors refer to this capability as strategic agility, comprised of three components: strategic sensitivity, leadership unity, and resource fluidity. These abilities are not limited to scheduled strategic reviews at a set cadence but are necessary on a more dynamic timeline to react immediately to rapidly changing business conditions. Reed (2021) tested these capabilities and demonstrated that strategic agility could be beneficial in unstable situations but less beneficial in stable situations. The post-COVID-19 environment is flush with instability and, therefore, should be ideal for firms to seek strategic agility and keep their supply chains agile.
Dynamic Sensing and Agility Capabilities
Researchers have shown notable interest in dynamic capabilities, which focuses on reorganizing current capabilities and resources to adapt to changing environmental conditions (Teece, 2007). These capabilities include firms’ abilities to sense environmental opportunities and threats and proactively respond to these threats to achieve a competitive advantage (Augier & Teece, 2009; Teece et al., 2016). Teece (2007) considered sensing, seizing, and reconfiguring as dynamic capabilities. Teece et al. (2016) refined this line to include sensing, agility (short-term response), and adaptability (long-term response) as a cluster of capabilities contributing to supply chain and firm performance. Research indicates these capabilities positively impact firm performance (Eriksson, 2014; Griffith et al., 2006).
Dynamic capabilities can differentiate between higher-performing and lower-performing firms (Easterby‐Smith et al., 2009). Dynamic capabilities differ from operational or “ordinary” capabilities, which pertain to an organization’s current or day-to-day operations (Teece, 2007). Dynamic capabilities instead refer to an organization’s capacity to intentionally create, extend, or modify its resource base (Helfat, 2007). According to the dynamic capabilities framework, core competencies should alter short-term positions that can then be used to form a longer-term competitive advantage (Teece, 2007). Dynamic capabilities are critical to operations in rapidly changing environments, similar to those conditions experienced in recent years. Supply chain dynamic capabilities, specifically sensing and agility, have been shown to lead to favorable results during the COVID-19 crisis, lessening the negative impact on operations (Do et al., 2021). Crisis events demonstrate that dynamic capabilities build further resistance to future crises (Ali et al., 2022). To emphasize the inclusion of supply chain sensing and agility in dynamic capabilities, going forward we will refer to that concept as “dynamic sensing and agility capabilities” (DSAC).
Dynamic Sensing and Agility Capabilities in SMEs
SMEs are at the heart of the global economy. However, supply chain scholars rarely examine small business DSAC (Weaven et al., 2021). Evidence suggests that SMEs – because of their fewer resources – are less prepared than larger organizations to withstand negative events (Bak et al., 2020). However, the countervailing perspective suggests that SMEs are often more agile and flexible than their larger counterparts. SMEs can also develop capabilities with partners to advance these capabilities (Bak et al., 2020). In turbulent times, like those experienced in recent years, SMEs must utilize the available tools to sense market conditions, seize opportunities (or minimize the impact of events), and reconfigure resources, if necessary (Cao, 2011). Given SMEs’ limited resources to absorb and withstand negative shocks, the benefits of sensing may be greater for SMEs than for large organizations. A thorough literature stream on SME resilience (a closely related theme to agility) exists (see Bak et al., 2020, for a complete review). To our knowledge, there is no comprehensive research on agility in SMEs; we could not find any research specifically connecting supply chain sensing and agility (DSAC) in SMEs. Therefore, the present research fills a gap not yet addressed in the literature.
Research Method
To gain a big picture of effective SME supply chain management, we surveyed leaders across a single industry – printing companies. Most printing companies are small businesses, with revenues significantly under the thresholds of $40 million and 500 employees set by the US Small Business Administration.
Printing firms are also adjusting to a supply chain that is radically changing; therefore, sensing and adapting to changes is paramount for printing companies. While nearly every industry has faced supply chain constraints in recent years, conditions are unusually difficult for the printing paper supply chain.[1] Demand for printing paper has decreased significantly in recent years. The simultaneous decline of printing (e.g., newspapers, print catalogs, direct mail, and textbooks) and increase in online commerce have driven multiple paper mills in recent years to transition from producing printing paper to manufacturing related products such as packaging materials, corrugated cardboard, and toilet paper. These same concerns have driven companies to shut down paper mills instead of making significant investments to upgrade aging and outdated operations. Consequently, the printing paper supply in the U.S. has decreased radically. For example, a recent study revealed multiple systemic supply chain issues in the printing industry. The issues included that paper distributors, companies who serve as intermediaries between paper mills and printing firms, reported having only one-third of their normal physical inventory. The shortage in distributor inventory directly contributed to paper mills’ reported inability to take additional customer orders until 2023, as they could not replenish their own inventory. Many were sold out of paper until 2023 and could not take additional orders. This is a radical departure from a decade ago in the printing industry when paper was a perpetually available commodity.
As of mid-2022, U.S. printing paper mills are currently operating at about 90% capacity. This elevated capacity utilization leaves little buffer or flexibility to increase orders; seasoned practitioners consider this “full capacity.” As of mid-2022, printing paper inventory in the U.S. is estimated at about 20 days, a situation experts describe as “hand-to-mouth.” If trends continue (mills converting away from paper and not replacing old technology), printing paper production in the U.S. could drop to half of its current capacity in the coming years. Given the challenges U.S. printing companies face today in procuring paper, this industry is an appropriate environment to explore how small businesses effectively manage their supply chain.
Survey Questions
Driven by the exploratory nature of the research, our survey included a plethora of supply chain questions. We solicited suggestions for questions from supply chain professors, subject matter experts, and regional printing industry association leaders. The questions measured the extent to which firm managers engaged in various supply chain activities using a 5-point Likert scale.
We deployed the survey using the online survey tool Qualtrics® to U.S. printing companies that were members of 15 regional printing trade associations. We kept the survey open for about three weeks and solicited participation through emails twice a week. After cleaning the data by removing surveys with a limited number of questions answered, we had 139 usable responses. This is well above the minimum recommended sample size of 80 for a statistical power of 80% with significance at the 5% level and a minimum R2 of 0.25 (Hair et al., 2022). Annual revenue for our sample ranged from $400 thousand to $380 million, with an average of $15.16 million. Employment levels ranged from zero to 400, with an average of 63.44 full-time equivalents (FTEs). While there is no “one size fits all” standard for small businesses, our sample meets the criteria set by the US Small Business Administration that small businesses have fewer than 500 employees.
Hypothesis Development
Remaining consistent with the DSAC view, we hypothesize that firms employing behaviors consistent with market sensing have a higher propensity for better performance. As discussed above, substantial literature identifies supply chain agility’s (SCA) positive impact on firm performance. However, research separating supply chain sensing (SCS) from SCA is sparse. One study positioned market sensing (Bharadwaj & Dong, 2014) as a dynamic capability that influences firm performance. However, we can also infer the value of SCS on performance from more specialized studies. For example, one study identifies the importance of sensing rogue seasonality variables in the coffee supply chain for developing mitigation plans and improving performance (Shukla & Naim, 2018). The sensing activities detecting the seasonality variables build firms’ capabilities to adapt rapidly and lessen the impact. Therefore, we propose our first hypothesis:
H1: Supply chain sensing is positively associated with firm performance in SMEs.
Many researchers have explored supply chain agility (SCA), attempting to explain the relationship between SCA and supply chain outcomes or firm performance (Blome et al., 2013; Gligor et al., 2015; Zakir et al., 2022; Zhu & Gao, 2021). Researchers have identified SCA as a key capability for supply chain management and subsequent positive firm performance (Alkurdi & Vázquez-Bustelo, 2021; Braunscheidel & Suresh, 2009; Gligor et al., 2015; Manzoor et al., 2022; Tse et al., 2016). Much of this research finds a positive relationship between SCA and firm performance in large organizations. However, researchers have not yet examined that relationship in SMEs. Therefore, we propose the following hypothesis:
H2: Supply chain agility is positively associated with firm performance in SMEs.
Dynamic sensing and agility capabilities (DSAC) form a higher-order construct from the combination of day-to-day operational activities. We posit that DSAC consists of a combination of sensing and agility. Therefore, we propose the following hypotheses:
H3a: Sensing is positively related to dynamic sensing and agility capability in SMEs.
H3b: Supply chain agility is positively related to dynamic sensing and agility capability in SMEs.
Dynamic sensing and agility capabilities help firms achieve long-term competitive advantage (Teece, 2007). This holds true even during crises (Makkonen et al., 2014). We posit that DSAC, consisting of sensing and agility, enhances firm performance. Therefore, we propose our fourth hypothesis:
H4: Dynamic sensing and agility capability is positively associated with firm performance in SMEs.
Research has shown that agility reduces the consequences of supply chain disruption, effectively cushioning the negative impacts an organization incurs because of supply chain disruption (Shekarian et al., 2020). Research links supply chain disruptions to negative firm performance in a variety of measures, both operational and financial (Hendricks & Singhal, 2003, 2005). Research also shows that DSAC lessen the impact of disruptions (Do et al., 2021). Therefore, we posit the following and final hypotheses:
H5a: Dynamic sensing and agility capability is negatively associated with supply chain impact.
H5b: Supply chain impact is negatively associated with firm performance.
H5c: Supply chain impact mediates the relationship between dynamic sensing and agility capability and firm performance.
Data Analysis
Initially, we applied exploratory factor analysis (EFA) to analyze the data our questions produced. Then we applied partial least squares – structural equations modeling (PLS-SEM). We describe both stages of data analysis below.
Exploratory Factor Analysis
We conducted Exploratory Factor Analysis (EFA) through Principle Components Analysis (PCA) to analyze data from 27 survey questions relevant to the supply chain and identify plausible constructs of interest using SPSS statistical software. We found that our data had sufficient correlations to be appropriate for PCA by running a Kaiser-Meyer-Olkin (KMO) and Bartlett’s test of Sphericity. A KMO measure of sampling adequacy above 0.6 demonstrates that data is well suited for factor analysis; the KMO for our data was 0.787. Bartlett’s test of Sphericity for our data (chi-square = 2795.523, df = 780, p < .001) indicates our variables had sufficient correlations such that an EFA would result in distinct, reliable factors.
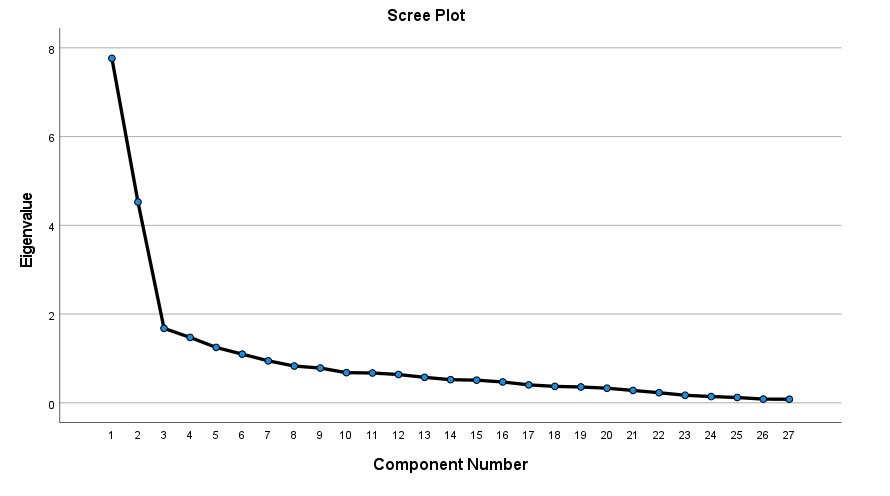
Our EFA analysis identified multiple factors with eigenvalues greater than 1. However, it has been argued that setting the threshold to one is arbitrary and tends to overestimate the number of factors (Fabrigar et al., 1999; Schönrock-Adema et al., 2009). An alternative method for identifying the number of factors is via Cattell’s Scree Test Plot test (Figure 1), a graph of factors and their corresponding eigenvalues. The inflection point is where a breakpoint occurs in the graph determining the number of factors to be kept, which in our case occurs at three factors explaining 57.21% of the variance.

Using Varimax rotation, we identified four factors in our data. Factor 1 contained eight survey items (Q11.1, Q11.2, Q11.3, Q11.4, Q11.5, Q11.6, Q11.7, Q11.8) appearing to measure firm performance (e.g., growth in sales, growth in profitability, net profit margin, etc.) with rotated loadings varying from 0.668 through 0.894. Factor 2, measuring sensing (SCS), contained five survey items (Q92_19, Q92_20, Q92_21, Q92_22, Q92_7) with rotated loadings ranging from 0.508 through 0.825. Factor 3, measuring agility (SCA), contained four survey items (Q92_14, Q92_17, Q92_18, Q92_8) with rotated loadings varying from 0.601 to 0.865.
The Cronbach’s alpha reliability coefficient measures the internal consistency of items within a scale and ranges typically between 0 and 1. Our test results of each latent variable were above 0.800. The Financial Performance subscale consisted of eight items (α = 0.93), the SCS subscale consisted of five items (α = 0.84), and the SCA subscale consisted of four items (α = 0.81). Generally, values above 0.80 are considered a good indication of internal consistency and reliability (Bland & Altman, 1997).
Factor 2 appeared to reflect SCS behaviors; Factor 3 appeared to reflect SCA behaviors. We applied survey items from these two factors to PLS-SEM measurement analysis, which formed the two lower-order constructs: SCS and SCA.
Applying PLS-SEM
To analyze our measurement and structural model, we applied PLS-SEM using the SmartPLS 3.3 software (Ringle et al., 2015). In exploratory research with prediction as the primary statistical objective, PLS-SEM is considered the preferred approach (Hair et al., 2022). Therefore, as we were developing new constructs (namely sensing, agility, and dynamic sensing and agility capability) and relating them to firm performance outcomes, PLS-SEM is appropriate. When modeling higher-order constructs such as dynamic sensing and agility capability in the present study, PLS-SEM is the preferred statistical method (Binz-Astrachan et al., 2014; Hair et al., 2019, 2022; Sarstedt et al., 2019). PLS-SEM enables the analysis of multiple constructs simultaneously and is particularly useful when considering closely held small businesses and or the sample size is relatively small (Binz-Astrachan et al., 2014; Manley et al., 2021, 2022; Wilson et al., 2014). Finally, because of the complexity of our structural model and its numerous measurement items, PLS-SEM is deemed preferable to sum scores or averages often used in regression analysis (Sarstedt et al., 2020).
Supply Chain Sensing
To measure supply chain sensing, we used five SCS survey items and a 5-point Likert scale anchored by “not at all” and “a lot” (Table 2). These survey items reflect the frequency firms employ tactics involving monitoring, assessing, and communicating activities and behaviors of customers and suppliers. The nature of these activities falls within the SCS definition.
Supply Chain Agility
To measure supply chain agility, we used five SCA survey items and a 5-point Likert scale also anchored by “not at all” and “a lot” (Table 2). These agility indicators include both “proactive” and “reactive” behaviors. Proactive behaviors include engaging in sales forecasting and placing orders for supplies without customer orders (Agility 1, Agility 2, and Agility 4), while reactive behaviors include timing supply orders (Agility 3). The nature of these activities falls within the SCA definition.
Dynamic Sensing and Agility Capability
Our approach in specifying a higher-order construct (DSAC) to represent the two lower-order constructs reflects: 1) the more abstract nature of the higher-order construct and 2) the interdependence of the two lower-order constructs, sensing and agility. Further, specifying dynamic sensing and agility capability as a higher-order construct facilitates simultaneous consideration of the two lower-order constructs and their effect on supply chain impact and firm performance.
Supply Chain Impact
To assess the impact of supply chain issues on business, we ied two survey items:
-
Impact 1: For what proportion of your work have you had to adjust turnaround times due to supply chain issues?[2]
-
Impact 2: Have you lost customers due to supply chain issues?
Respondents utilized a 5-point Likert scale to indicate the extent to which supply chain disruptions had adversely impacted their business, with one reflecting the least impact and five the most impact. Again, supply chain professionals and subject-matter experts agreed that adjusting turnaround times (quality of service, i.e., lead time) and losing customers because of supply chain issues are appropriate indicators of supply chain impact.
Firm Financial Performance
For our firm performance dependent variable, we utilized Eddleston and Kellermann’s (2007) self-reported perceptual survey items. This is consistent with prior small business research (Manley et al., 2021; Williams et al., 2018) and operations management research (Kaynak, 2003; Manley et al., 2022). Such subjective measures are particularly appropriate when objective “hard” measures of firm performance are not readily available, which is often the case with closely held private companies (Love et al., 2002). Self-reported perceptual performance measures are generally highly correlated with objective measures (Honig & Samuelsson, 2012; Shepherd & Wiklund, 2009). On a 5-point Likert scale anchored by “much worse” and “much better,” respondents rated their firms’ performance relative to their competitors across eight indicators: sales growth, profitability growth, growth in market share, growth in employment levels, return on equity, return on total assets, net profit margin, and their ability to fund growth from profit. Together, these eight indicators serve as our proxy for firm performance.
Control Variables
Researchers often evaluate effects by controlling for variables that might influence the results if omitted. Consistent with prior research (Gibson & Cassar, 2002; Manley et al., 2021, 2022; Risseeuw & Masurel, 1994; Williams et al., 2018), we controlled for firm size in both sales and employees. The path coefficient for sales was 0.113, while the path coefficient for the number of employees was 0.271. With both controls included, the path coefficient was 0.338 (p = 0.000); thus, we control for firm size.
Results
To test our hypotheses and explore the relationships between sensing, agility, dynamic sensing and agility capabilities, supply chain impact, and firm performance, we utilized SmartPLS 3.3 (Ringle et al., 2015) to assess the measurement and structural models (Hair & Sarstedt, 2021). The measurement model included nine indicators for two lower-order constructs (sensing and agility) that together comprise dynamic sensing and agility capability, a higher-order construct. Two indicators measured supply chain impact, two variables (size in sales and number of employees) were used as controls, and eight indicators measured our proxy for firm performance. Finally, we utilized confirmatory tetrad analysis in SmartPLS to confirm that we had appropriately specified our lower-order constructs. At the 95% confidence interval, virtually all the lower values of the indicators were negative, while the upper values were positive. This confirms that our measurement model was correctly specified as reflective. The measurement and structural model, including path coefficients and the R2 value, are shown in Figure 2.
Evaluation of Measurement Model
Following the confirmatory composite analysis process Hair et al. (2020) recommended, we assessed the PLS-SEM results. The measurement model contains one higher-order construct (HOC), dynamic sensing, and agility capability. Dynamic sensing and agility capability is an exogenous HOC specified as a type II, meaning the lower-order constructs use reflective measures for the indicators, with those lower-order constructs (LOCs) serving as formative measures for the higher-order construct (Sarstedt et al., 2019). Based on the type II specification of the HOC, the two LOCs together represent relatively more concrete components that form the more abstract HOC, dynamic sensing and agility capability. We utilized the repeated indicators approach to specify the HOC, first assessing the reliability and validity of the reflective indicators of the LOCs before evaluating the formative HOC. To do so, we assessed the size and significance of the factor loadings, composite reliability (CR), and average variance extracted (AVE) of the LOCs and the HTMT ratios to establish discriminant validity. Our other exogenous construct of interest, supply chain impact, is measured using two reflective indicators. The firm performance endogenous construct is measured using eight reflective indicators. The nomological validity of the constructs and indicators was assessed by a panel of subject-matter experts, academicians, and printing industry practitioners.
We share the results of our assessment of the measurement model in Table 2. The measurement model exceeded Hair et al.'s (2019) guidelines for composite reliability, greater than 0.70, and convergent validity (AVE), greater than 0.50. Composite reliabilities for sensing, agility, supply chain impact, and firm performance were 0.893, 0.870, 0.758, and 0.946, respectively. The AVE values for the LOCs sensing and agility that comprise the HOC dynamic sensing and agility capability were 0.628 and 0.627, while the AVE for firm performance was 0.687. We ran SmartPLS’s bootstrapping algorithm using 10,000 subsamples to ensure the statistical significance of all the indicators. All indicators were significant, with p-values near 0.000. Therefore, we confirmed convergent validity, reliability, and significance for all constructs included in the structural model.
To ensure the distinctiveness of our constructs, we assessed discriminant validity using the Heterotrait-Monotrait (HTMT) ratio of correlations recommended by Henseler, Ringle, and Sarstedt (2015). All our HTMT values shown in Table 3 were lower than the recommended guideline of 0.85, with the highest value at 0.614 for the LOCs sensing and agility. Again, using the SmartPLS bootstrapping algorithm with 10,000 subsamples, none of the values in the confidence intervals were equal to one. Thus, having established discriminant validity, we assessed nomological validity with other constructs in the nomological net (Hair et al., 2019). The results were generally consistent with our theoretical direction, expected size, and significance of the correlations, thus confirming nomological validity.
To assess the convergent validity of the formative HOC dynamic sensing and agility capability, we followed the process specified by Hair et al. (2019, 2023). We ran a redundancy analysis relating the higher-order construct to a single-item measure. Our redundancy analysis yielded a path coefficient of 0.551 (p = 0.000) between the HOC dynamic sensing and agility capability and a single-item measure of dynaDSAC (Sensing 1). Bootstrapping using 10,000 subsamples produced a lower boundary of 0.447 and an upper boundary of 0.668 at the 95% confidence interval, supporting convergent validity of the HOC dynamic and agility capability. Two additional metrics must be evaluated for the formative HOCs sensing and agility. The first is to assess the collinearity between the LOC indicators; all VIF values were below the maximum level of 5.0, and all but two (Sensing 2 and Sensing 3) were below the recommended level of 3.0 (Sarstedt et al., 2019). Finally, all the LOC indicators of the formative HOC were significant and meaningful in size.
Structural Model Evaluation
To evaluate our structural model, we continue to follow the confirmatory composite analysis (CCA) process recommended by Hair et al. (2020). For hypothesis one, we examined the relationships between sensing and firm performance (FP) independently without the presence of other constructs in the structural model. With a path coefficient of 0.292 (p = 0.000), we found support for hypothesis one. Similarly, we tested the relationship between agility and FP. With a path coefficient of 0.283 (p = 0.000), hypothesis two was also supported. Examining the simultaneous effects of sensing and agility on FP, we found path coefficients of 0.197 (p = 0.024) and 0.174 (p = 0.057), respectively. Next, we examined the relationships between the two LOCs (sensing and agility) and our hypothesized HOC, dynamic sensing and agility capability (DSAC), along with the subsequent impact of DC on FP. The path coefficients were 0.670 (p = 0.000) and 0.475 (p = 0.000), respectively, and we found that DC positively impacts FP with a path coefficient of 0.295 (p = 0.000). Even with a low r2 of 0.087, we conclude that hypotheses 3a, 3b, and 4 are all supported.
Having supported our hypotheses regarding the impact of the HOC-dynamic sensing and agility capability on firm performance, we next examined the potential mediating effect of supply chain impact (SCI). To establish the potential for mediation, we tested the effects of DSAC on SCI and SCI on FP independently. With a path coefficient of 0.250 (p = 0.001), we did not find support for hypothesis 5a. We expected DSAC to have a negative relationship with SCI. Further, this surprising finding confounds our hypothesis 5c regarding SCI’s mediating the relationship between DSAC and FP. Nonetheless, we examined the relationship between supply chain impact and firm performance. The path coefficient of -0.210 was negative, as hypothesized, although the path was not significant (p = 0.208), and the R2 value for firm performance was quite low at 0.044. Thus, we also reject hypothesis 5b. We also executed the PLS algorithm on the entire structural model, excluding the controls, to examine the relationships with the mediator included. Unsurprisingly, DSAC’s impact on FP actually increased to 0.341 (p = 0.000), and the r2 also increased to 0.125. Thus, the explanatory power of our structural model yields the best results when simultaneously testing the impacts of DSAC and SCI on FP.
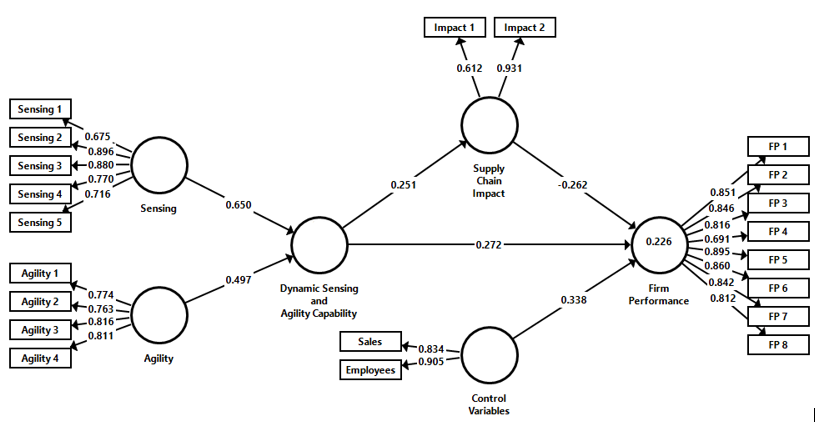
Finally, we tested the structural model with the control variable size (in both sales and number of employees) included. The coefficient for dynamic sensing and agility capability’s path to firm performance decreased to 0.272 (p = 0.001), and the path coefficient for supply chain impact’s effect on firm performance increased in both size and significance (path coefficient = -0.262, p = 0.004). The path coefficient for dynamic sensing and agility capability to firm performance was relatively unchanged at 0.251 (p = 0.003). Incorporating all constructs and the control variables into the structural model, the R2 value for firm performance was 0.226. All path coefficients were significant, although the positive relationship between dynamic sensing and agility capability, and supply chain impact remained. Considering these results, we conclude that the control variable – with its path coefficient of 0.338 (p = 0.000) – is important when considering firms’ dynamic sensing and agility capability and its effects on supply chain impact and firm performance. Below, Figure 3 shows the PLS-SEM results for the full structural model. Table 4 summarizes the path coefficients, significance levels (T-statistics and p-values), r2 values, and the results of the hypotheses tests with the control variable excluded from the model. Hypotheses 1, 2, 3a, 3b, and 4 were supported, while hypotheses 5a, 5b, and 5c were rejected.

Predictive Validity
To assess in-sample prediction, we examined the f2 (effect size) value. The effect sizes for DC and SCI are 0.087 and 0.082, respectively, which are small (Cohen, 1992). To assess the out-of-sample predictive validity of the model, we utilized the PLSpredict algorithm (Shmueli et al., 2016) in SmartPLS and compared the results on the Q2 predict value and the linear model (LM) approach (Hair & Sarstedt, 2021). In executing the PLSpredict algorithm, we opted for 10 folds and 10 repetitions and included both the control variable and the mediator in the model. An initial examination of the Q2 predict values found that all the values were positive, thereby confirming that our model has good out-of-sample predictive power. A comparison of the root mean squared error (RMSE) revealed that all but one (FP 5) of the structural model prediction (PLS-SEM) errors were lower than the LM values. Thus, we conclude that the model has high out-of-sample predictive power (Shmueli et al., 2016, 2019). Results are shown in Table 5 below.
Discussion and Conclusion
This section discusses our findings for both academics and practitioners. Additionally, we discuss the limitations of our research design and suggest several directions for future research.
Academic Implications
In our examination of an industry (the printing industry) facing challenging times, we find that sensing and agility are both positively related to firm performance. We also find that these two constructs combine to form a higher-order construct, which we call dynamic sensing and agility capability. Although the effect of each LOC (sensing and agility) is relatively small, it is important to note that the findings are indeed significant. Increasing sensing and agility enhances firm performance. Further, our HOC dynamic sensing and agility capability enhances firm performance, consistent with Aslam et al. (2018). Many, nearly infinite factors can influence firm performance, and even a small increase can enhance sustainability.
Surprisingly, we found a positive and significant relationship (p = 0.002) between dynamic sensing and agility capability and supply chain impact. This surprise finding confounds our hypothesized mediating effect of supply chain impact on the relationship between dynamic sensing and agility capability and firm performance. Another surprise finding from our research is that supply chain impact was unrelated to firm performance. Even though the path coefficient was negative (as expected), the p-value of 0.206 reveals that the relationship is not statistically significant.
To better understand these surprise findings, it is important to note that our measure of supply chain impact included self-reports of 1) changing turnaround times due to supply chain issues and 2) losing customers due to supply chain issues. Further, the unique environmental conditions might also explain why our hypothesized relationships were not supported. When the surveys were submitted, global supply chain conditions were the most difficult of the past 25 years (New York Fed Supply Chain Index).[3] The printing industry faced these and other industry-specific conditions that limited the supply of printing paper available to printers. Without printing paper, printers simply cannot produce.
In a normal world, one would expect supply chain conditions to affect financial performance and partner organizations. In fact, multiple well-cited studies underscore this position (e.g., Hendricks et al., 2009; Hendricks & Singhal, 2003, 2005). For those printers in our sample, one would expect that if a customer could not receive a requested job from a supplier (in this case, the printing firm), the customer would replace the printer with a competitor. However, unlike local disruptions that only affect individual organizations, these difficult supply chain constraints faced the entire printing industry. Customers could not easily replace their supplier with another printer because the new print company would be facing the same conditions. Additionally, even though printers were forced to adjust turnaround (lead times), this did not negatively affect firm performance. Again, customers likely had no other options.
Our study contributes to academic literature as we reinforce the finding that sensing and agility are different constructs. Additionally, we find that the dynamic sensing and agility capability formed from sensing and agility relates to improved firm performance. However, in difficult conditions facing an entire industry, the impact of supply chain disruptions may not affect financial performance.
Managerial Recommendations
Based on our study’s results, we provide recommendations to practitioners in the printing industry and SMEs in general. Our study finds a positive relationship between sensing and firm performance, as well as agility and firm performance. We understand that SMEs may have limited financial resources to “throw at” a problem. However, we cannot ignore the importance of sensing and agility. There are significant investments that SMEs can undertake to improve sensing and agility, including visibility platforms, technology upgrades, and a flexible workforce. However, given the constrained resources of SMEs, we highlight a few ways leaders can apply sensing in their supply chains by undertaking cost-reasonable activities. For example, SCS activities in our survey included things such as recording and monitoring supply chain issues’ effect on turnaround times and lost jobs or customers, continually assessing each supplier’s commitment to your firm, assessing your trust in each supplier, showing appreciation for a supplier’s role in, and contribution to, your business, and having regularly scheduled meetings with major suppliers to discuss issues and plans. Collaborative activities like information sharing, communication, and shared knowledge are shown to build response through increasing visibility (Scholten & Schilder, 2015); sharing information between SC partners can increase capabilities with very little cost. Concerning SCA activities, SME leaders can let forecasts and historical purchasing drive monthly advance purchases, setting supply chain related strategic goals regarding inventory levels and placing recurring supply orders. SMEs can implement all the tactics implied in our survey items at a relatively low cost.
Additionally, we advocate that SMEs build as much agility into their operations as possible. This may be slightly more difficult. However, the items assessed in our survey provide further recommendations for managers that incorporate proactive and reactive agility elements. SMEs can work (proactively) with their supply chain partners collaboratively to improve forecasting. Additionally, managers can incorporate reactive elements, including changing the timing of ordering suppliers.
Research Limitations
All research has limitations, and we acknowledge those in this research. Although we followed best practices in creating and reporting survey research, we utilized a single research method. Surveys cannot provide the detail that in-depth interviews can provide and cannot confirm causality in the way experiments can. Multi-method research can help to cover the flaws of single research methods. Additionally, our survey was conducted via self-reported measures. Our research was exploratory in nature. This exploratory design fits the nature of the research as we study a novel research area. Therefore, we are justified in using items that have not been comprehensively tested. Yet the fact that these measurement items have not been comprehensively tested is a weakness of the present research. The exploratory nature of our research resulted in the exclusion of several items from the final measurement model. Finally, our research was limited in design to focusing on a single industry. It is possible that our findings would not replicate across other industries.
Further Research
We suggest some directions that future scholars can take in building on this research. The first and easiest extension of our research is to examine a different sample than the printing industry to examine if our conclusions extend across industries. Further research could examine a single different industry or a sample including multiple industries. Another extension of this research would be to utilize the same questions in a different time period. Examining the same research questions when conditions have returned closer to “normal” would provide an interesting replication of the study. Additionally, future scholars could build on the insights in our survey with qualitative research. Depth interviews would help gather deeper insights within the printing industry or in a separate industry as to why organizations would (or would not) execute sensing or agility. These in-depth interviews could also help explain why some of our hypotheses were unsupported. Additionally, further research could compare SMEs with large organizations.
We drew points related to printing industry paper supply chain problems from various industry sources, including the following: Printing Industries Alliance, Signature Magazine, April/May 2020; Millcraft – 1st quarter 2022 Graphic Paper Industry Update; Millcraft – 2nd quarter 2022 Graphic Paper Industry Update; discussions at the Printing Industry of the South 2022 convention; and Printing Industries of New England, Membership Magazine, May 2022.
Turnaround time is a term common in the printing industry. Turnaround time measures the time from when an order is received from the customer to the time it is shipped from the printer. Turnaround time directly influences lead time, the time from order received from the customer to the time product is received by the customer.