Introduction
The firm’s value propositions (Bowman & Ambrosini, 2010; Schiuma et al., 2012) are important in terms of what it provides and how it is aligned to fulfill customer expectations. Competition is tough in the information age and customers demand more from companies. They want quality products, customized experiences, and sustainable company operations (Lobo et al., 2024; Lobo & Samaranayake, 2020; Mitavskiy et al., 2009). A well-optimized value offer enables organizations to better recruit, retain and build loyalty among their consumers, resulting in long-term success and competitiveness (Frow & Payne, 2011; Heikka & Nätti, 2018; Tung et al., 2014).
This study focuses on digital fashion SMEs in West Java, Indonesia, which is facing severe challenges due to the lack of capital, workforce, and technology (Chan & Zailani, 2024; Liu et al., 2024). These constraints limit the company’s ability to innovate, improve product quality and provide better services, which ultimately affects its competitiveness in the fashion industry (Berman, 2012; Butt et al., 2024; Ofoegbu, 2023). These challenges require a systematic and data-based approach to the enhancement of value propositions so that SMEs can make better use of their resources and satisfy customer needs (Diderich, 2024; Parkinson et al., 2019; Piepponen et al., 2022). Fashion is one of the leading categories in the Indonesian e-commerce ecosystem. Recent advances in internet technologies and mobile commerce have opened up opportunities for small and medium enterprises in the fashion industry to access domestic and global markets without the need for physical outlets. The Indonesian fashion industry is estimated to be worth more than IDR 200 trillion annually, a significant slice of the creative economy, driven by a strong trend for local products. Moreover, there is huge growth in the adoption of digital technology by SMEs. It is predicted that by 2025, about 63% of SMEs including the fashion industry will actively use digital tools in their business (Market Research Indonesia, n.d.). It is this potential that has led to the choice of fashion SMEs as the case study for this research.
Some major markers of a value proposition are fit to customer needs, unique benefits of the product, obvious differentiation from competitors, and measurable results that demonstrate how the product is solving specific pain points. The results of the research are shown in Table 1. The key indicators of the value proposition of the SME are as follows: product quality, low price, customer-oriented services, etc. (Bilgin Mawson, 2024; Kouptsov & Srai, 2023; Ziaie et al., 2021). Together, these indicators determine the SME’s ability to meet customer expectations and maintain its position in the market.
The value propositions in the fashion industry are built on the delivery of a range of key elements that are attractive to customers (Boffa & Maffei, 2024; Saeedikiya et al., 2025; Zhu, Zhang, et al., 2024). For example, product quality guarantees compliance with industry standards, and modest and elegant designs appeal to consumers who want stylish but value-driven clothing (Gong & Yang, 2024; Gritt et al., 2024). The low price increases the market attractiveness of the SME and makes the products accessible to more consumers (He et al., 2024; Jafari-Sadeghi et al., 2023; Wang et al., 2024). Other factors like return guarantees and frequent promotional activities also help in building trust and loyalty (Elia et al., 2024; Ologeanu-Taddei et al., 2025; Sumbal et al., 2024). In addition, the SME can adapt to different customer needs, such as small batch orders, through custom product services and low MOQ production (Song et al., 2025; Westergren et al., 2024; Zhu, Huang, et al., 2024; Ziaie et al., 2021).
IPA is a method for identifying customers perceptions of the importance of product or service attributes and performance. Such an analysis assists organizations in pinpointing areas for improvement and in directing resources accordingly. In this study IPA is used to optimize value propositions. IPA is a strategic tool which evaluates attributes based on their importance for customers and the company’s performance delivering them (Deng, 2008; Eskildsen & Kristensen, 2006). Attributes are mapped into four IPA quadrants (high importance–high performance, high importance–low performance, low importance–low performance, low importance–high performance), highlighting areas needing immediate improvement (Ho et al., 2016; Mikulić & Prebežac, 2008), continued excellence, or diminished focus, providing a clear path to align resources with customer priorities (Duke & Mount, 1996; Magal et al., 2009). In order to improve the value proposition, it is necessary to consider the risks and feasibility of each alternative to find the most optimal solution.
The main purpose of this study is to find out the differences between importance and performance levels of product or service attributes based on customer perceptions and to assess the most relevant improvement priorities. The choice of the IPA method is justified by the fact that it is consistent with the practical and contextual objectives of the case study analyzed, that is, to provide a clear and easily interpretable mapping of which attributes should be preserved, improved or reallocated in terms of resources. Therefore, this research is based on customer perceptions of attributes and their performance, which are the basis of the IPA analytical framework.
The IPA results serve as a basis for developing a system dynamics model to simulate strategic interventions in order to improve value propositions (Haggège et al., 2017; Heikka & Nätti, 2018). The system dynamic model developed in this study is a supportive tool for the analysis of IPA. This enables an examination of the effect of changes in the attribute performance on customer perceptions and the implications of such changes for the overall performance of the system over a given time horizon. Hence, the IPA with dynamic system model is expected to provide a more comprehensive and sustainable understanding than pure static analysis. The research shows Feasibility and Risks are combined to provide practical and affordable solutions. The specific objectives of this study are:
-
To analyze performance and importance of value proposition’s attributes by IPA.
-
Develop a system dynamics model to simulate possible improvements.
-
To evaluate the risk and feasibility of the recommended best solution.
From a holistic perspective, the current study provides practical insights to SMEs (Antonio et al., 2024; Lindström et al., 2024; Weng et al., 2024) on how to improve their value propositions while balancing operational constraints and customer expectations (Annamalah et al., 2023; Rojas-García et al., 2024; Sun et al., 2024).
The novelty of this research is the integration of customer survey data with IPA and system dynamics simulations of value propositions, along with risk and feasibility evaluations. The findings of this study cannot be generalized directly to all SMEs. Rather, they intend to make conceptual and methodological contributions that can be transferred to other SMEs contexts that share similar features.
Literature Review
Customer Satisfaction and IPA
IPA offers a conceptual model to evaluate the correspondence between the perceived importance of attributes and their actual performance. Customer satisfaction is an important factor in measuring how far a company’s products or services meet or exceed customer expectations (Gawor & Hoberg, 2019; Lindič & da Silva, 2011). High satisfaction levels are directly linked to greater customer loyalty, repeat purchases, and positive word-of-mouth recommendations (Baidya et al., 2023; Chiu et al., 2023). Loyal customers significantly reduce the customer acquisition costs and boost the overall company profitability and reputation in the market. Happy customers are more likely to trust a company, which in turn improves the company’s reputation and increases its market share.
Value propositions are an important differentiator for competitive industries where many companies provide the same services and products. A compelling value proposition clearly articulates the unique benefits a business offers and how those benefits will solve customer needs and problems. In practice and prior research, key elements supporting effective value propositions have been seen to be product quality, fair pricing, personalized service and additional reassurances such as return policies. The combination of all of these aspects contributes to meeting customer expectations, building trust and loyalty, and remaining competitive in the market.
The Role of IPA
IPA is an important tool to analyze customer satisfaction and to create value proposition (Aigbedo & Parameswaran, 2004; Mohammed et al., 2017). IPA is used by companies to evaluate the importance and performance of specific traits to determine their strengths and weaknesses (McLeay et al., 2017; Tsoukatos, 2008). This method of analysis allows to align the product offerings with the customer expectations and to optimize the resource allocation (Matzler & Sauerwein, 2002).
Strategic Application of IPA
By categorizing the value proposition indicators within the IPA framework, businesses can develop targeted strategies for the improvement of the value proposition (Huan & Beaman, 2007; Prajogo & McDermott, 2011; Ringle & Sarstedt, 2016). Attributes located in Quadrant II (high importance, low performance) are targeted for improvement, while attributes in Quadrant I are strengths to be maintained (Ikasari et al., 2022). Less important attributes in Quadrants III and IV can be de-prioritized or maintained with minimal resources. The systematic process ensures that companies use resources effectively to improve their performance and competitiveness.
Feasibility and Risk
Then for each simulated scenario, feasibility and risk assessment is applied. So that decisions are taken about the feasibility and risk to the business as well as the customer preferences. Feasibility is an important tool in the business and project decision making. In general, a feasibility study includes three major aspects, i.e. market, technical and operational, and finance considerations (Chumaidiyah et al., 2025; Clifton & Fyffe, 1977). Feasibility is, in SMEs, often dictated by scarce resources, such as capital, human resources and market access. Chumaidiyah et al. (2024) proposed SMEs feasibility model by integrating the Business Model Canvas (BMC), functional organization and supply chain management. The model identifies five important variables: supply chain, production, value proposition, marketing and finance. This paper extends the development of this model with specific focus on the value proposition element. Some researchers have investigated feasibility from the point of view of finance feasibility (Ahmmed et al., 2025; Krishnappa et al., 2025).
In financial analysis of business feasibility, risk factors are usually considered. Risk analysis is used to determine if a business or project is feasible or likely to fail. Risks are inherent in business activities and come from operational, environmental, macroeconomic, financial, managerial risks (Cakir et al., 2025). Specific types of risk include information technology risk, financial risk and information risk that impact decision-makers. When assessing business risks, they are categorized based on the likelihood of occurrence and the potential impact of the risk event. Based on this assessment, the risks are classified as low, medium, and high (Maguire et al., 2019). Frameworks and standards have been developed and further built on the disciplines of risk science and decision-making to guide under conditions of risk and uncertainty (Challinor, 2025).
Integration of IPA, Feasibility, and Risk
Previous studies have largely used IPA, Feasibility Analysis, and Risk Analysis as standalone tools or in limited combinations, which restrict holistic decision making. The IPA is useful for prioritizing the critical factors but does not take into account the resource constraints or the uncertainty; Feasibility Analysis deals with the practicality of proposed actions but often does not have a systematic basis for prioritization; Risk Analysis often considers uncertainty in isolation from earlier stages of decision making. To overcome these limitations, this study proposes a sequential framework to integrate the three methods, in which, IPA is used to identify the priority factors, Feasibility Analysis is used to evaluate the feasibility of improving the priorities, and Risk Analysis is used to handle the uncertainty faced by feasible, high-priority actions, thereby improving the robustness and coherence of the decision-making process.
System Dynamics Method and Application
In various fields, such as strategic planning, system dynamics has been widely applied to analyse the long-term impacts of decisions made by organizations. Organizations can formulate more precise and effective strategies by conducting system dynamics simulation, thus achieve their desired long-term goals (Morecroft, 2007; Sterman, 2000). The models include a number of important variables such as financial performance, market demand, production capacity and other interrelated elements of the system in the context of strategic planning. A key technique in this modelling approach is the use of Stock and Flow Diagram (SFD) which depicts the dynamic evolution of these variables and their interdependences over time (Forrester, 1961). This approach enables organizations to better understand the internal and external dynamics that impact long-term performance and thus provides useful insights for strategic decision making.
Methodology
The current research is a quantitative systematic descriptive approach to collect and analyze data that provides broad insights into the importance and performance of the value proposition attributes (Haverila et al., 2021; Tontini & Picolo, 2014). This approach helps SMEs to obtain actionable insights from customer feedback and align its offerings with customer expectations.
The study is carried out using a quantitative descriptive method and is supported by two analytical methods, namely IPA and System Dynamics modelling. There are four main stages in the research process:
-
Survey Data Collection
Data were collected using a structured questionnaire to determine the perception of respondents on the importance and performance of some selected attributes. This is the quantitative basis for the following analysis.
-
IPA
The attributes were clustered into four quadrants based on perceived importance and performance using IPA. It offers a valuable way of determining what attributes are more important to improve or to focus on strategically.
-
Simulation of System Dynamics
The prioritized attributes from IPA were used to simulate the strategic scenarios by System Dynamics modelling. This simulation outlines the relationships among the different variables and predicts possible outcomes from various strategies over time.
-
Risk and Feasibility Assessment
After simulation of each scenario, the analysis considers risk (e.g. market uncertainty, operational risk) and business feasibility (e.g. cost, resource requirements, profitability). This ensures that the chosen strategies are not only customer-centric but also sustainable and resilient.
Survey Design
The data was gathered using a well-structured questionnaire that was administered to 31 respondents who had previous dealings with the SMEs. The sample size was fixed at N = 31 based on Cohen’s (1988) recommendations for detecting a medium effect size (d ≈ 0.5) with α = 0.05 and power = 0.80, which requires approximately 27–30 participants. Moreover, previous studies using similar exploratory designs (Creswell, 2014; Yin, 2018) usually include 20–50 respondents. With the small population within one organization, N = 31 is adequate for exploratory purposes and for estimating initial effect size. To select a good mixture of respondents, repeat customers and new clients were selected. Respondents were women age 17-50 years old who were housewife, female worker or entrepreneur with income above 5 million rupiah per month. The present study is a single site case study with survey data from 31 of 50 (62%) participants in a single organization. The key indicators were rated on a 5-point Likert scale ranging from 1 (Very Unimportant/Unsatisfactory) to 5 (Very Important/Satisfactory) to allow for nuanced feedback.
The Table 2 survey was designed to assess the importance of these indicators and their performance, giving a balanced view of what customers care about and how well the SMEs deliver to those expectations.
Implementation Process
The survey was made available in both paper and electronic formats, which improved accessibility and convenience for the respondents. The questionnaire contained clear instructions to guide respondents in its completion and assistance was available for any questions. To facilitate timely data collection while maintaining the quality of responses, a one-week timeline for survey completion was adopted. To encourage participation, respondents were told that their feedback would be used to improve the SME’s offerings.
The validity was tested by Pearson Product-Moment correlation at 5% significant level (α = 0.05). The critical r value (r table) was 0.361 with the total number of respondents of 31. Reliability tests were conducted using Cronbach’s Alpha and the results were as follows: Performance (α = 0.83) (reliable); and Importance (α = 0.9777) (highly reliable). The Cronbach’s Alpha values were above the minimum threshold of 0.70, indicating that the instrument has good to excellent internal consistency.
Data Analysis Process
Once the responses were obtained, the data were aggregated to determine the total and mean scores of the indicators. The scores provide a systematic assessment of the relative importance and performance of each attribute (Musa et al., 2010). The calculations used the following formulas:
Total Score: ∑Xi = X1 + X2 + X3 + … + Xn
Average Score: (∑Xi) / n
Where: Xi = Value of item i, n = Total items.
The scores obtained were plotted on a Cartesian diagram based on the IPA framework (Barokhah et al., 2022; Yang et al., 2021). The IPA results were used to develop targeted strategies for the SME according to the positioning of each indicator within the quadrants:
-
Quadrant II Performance Gaps (High Importance, Low Performance)
-
Quadrant I Indicators (High Performance, High Importance)
This strategic classification helped to allocate resources in an efficient way to optimize the SME value propositions. The results of the IPA also provided inputs for definition of control variables in the dynamic system model. This model simulated and evaluated potential improvements providing actionable insights in aligning the SME’s offerings with customer expectations and optimizing operational efficiency.
Simulation Process
The system dynamics model was constructed based on the behavior patterns of the elements in the value proposition system of SME X, a digital fashion SMEs in West Java, Indonesia. Historical data was collected over 19 months from January 2023 to July 2024. The data set contains sales and promotion records, financial statements, product development cost, labor cost, product quality measures, advertisement cost, quantity human resource workers, revenue and other relevant operational data. These are the research limitations and the constraints for the development of the system dynamics model.
Results and Analysis
The study provides empirical evidence about the performance and perceived importance of the SME’s value proposition attributes. The customer feedback data was systematically analysed to assess the extent to which the company’s performance matches customer expectations, enabling the identification of attributes that need strategic improvement and those that need to be sustained. Table 3 reports the aggregated scores of performance and importance evaluations as reported by respondents. These scores provide a preliminary assessment of customer perceptions of the SME’s value proposition attributes and a basis for further importance–performance analysis.
High importance scores indicate attributes that are important to customer satisfaction and performance scores reflect how well the company is delivering against customer expectations. The results show that the four variables with the highest scores in importance-performance analysis are promotions and discounts, product quality, affordable pricing and product design.
Average Performance and Importance Ratings
Table 4 presents the average performance and importance scores, which were used as the benchmark for plotting on the IPA chart. These scores are the axes upon which the IPA chart is divided into four quadrants.
The IPA results that found three variables of low performance but high importance:
-
I-2 (Product Design) – Emphasize aesthetics and functionality to increase customer appeal.
-
I-4 (Return Guarantee): Optimize returns management processes to enhance customer confidence.
-
I-5 (Promotion & Discount) Ensure the budget for promotions and digital marketing activities is optimized for greater effectiveness
Causal Loop Diagram (CLD) Value Proposition
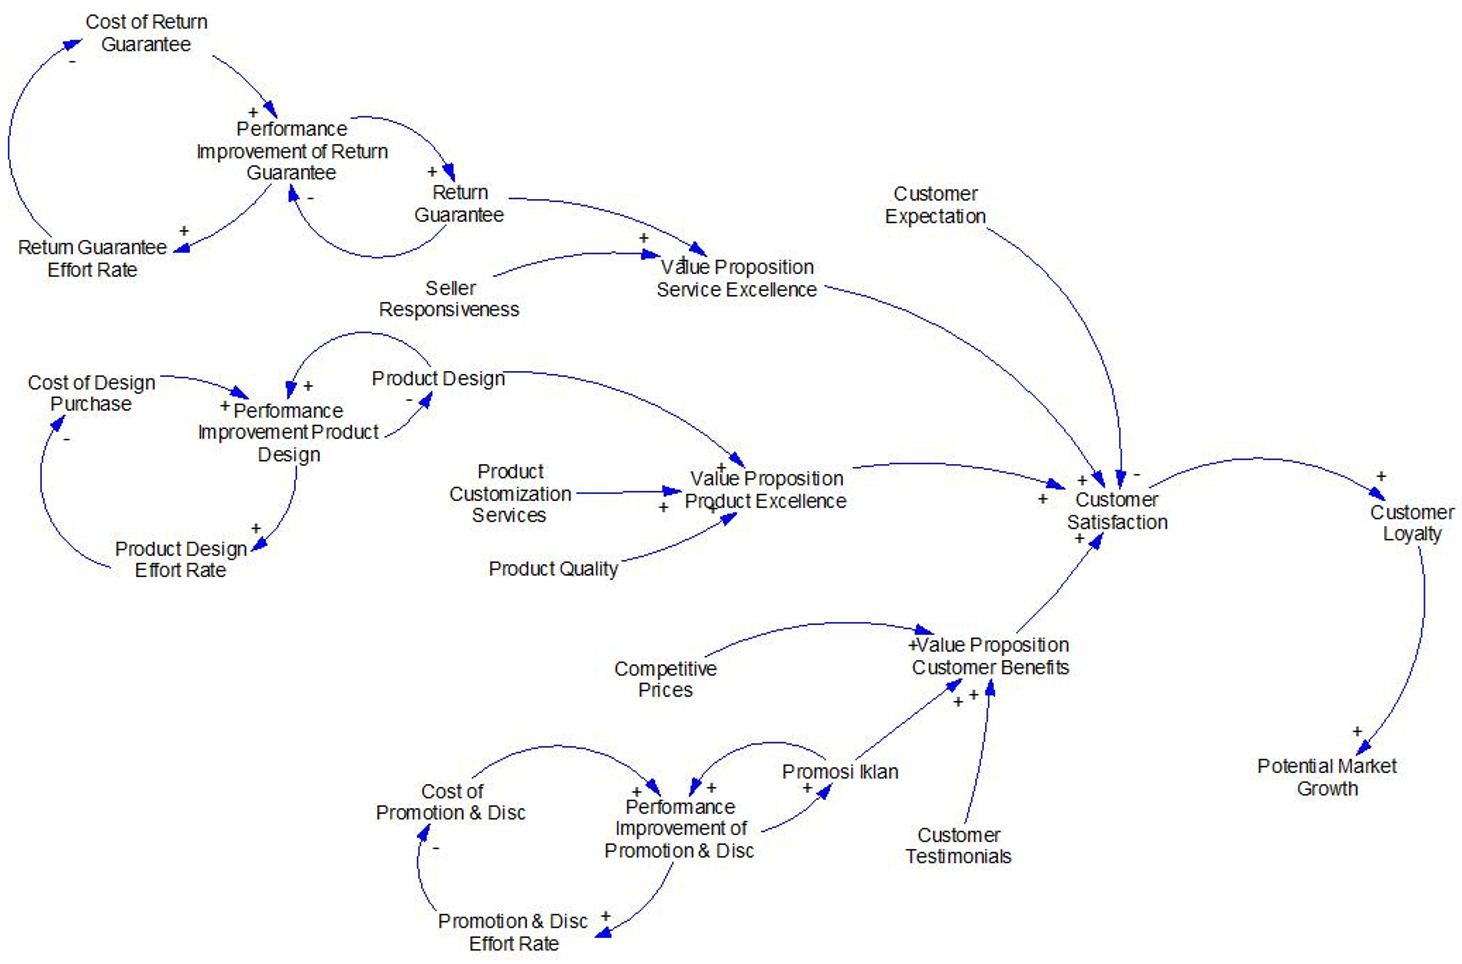
The Value Proposition Model. This is shown in the CLD (Figure 1). It shows the dynamic interaction of the three research variables that are (1) return guarantee as service excellence, (2) product design as product excellence, and (3) promotion & discount as customer benefit. Such interactions can identify strategic areas SMEs can focus on to improve competitiveness.
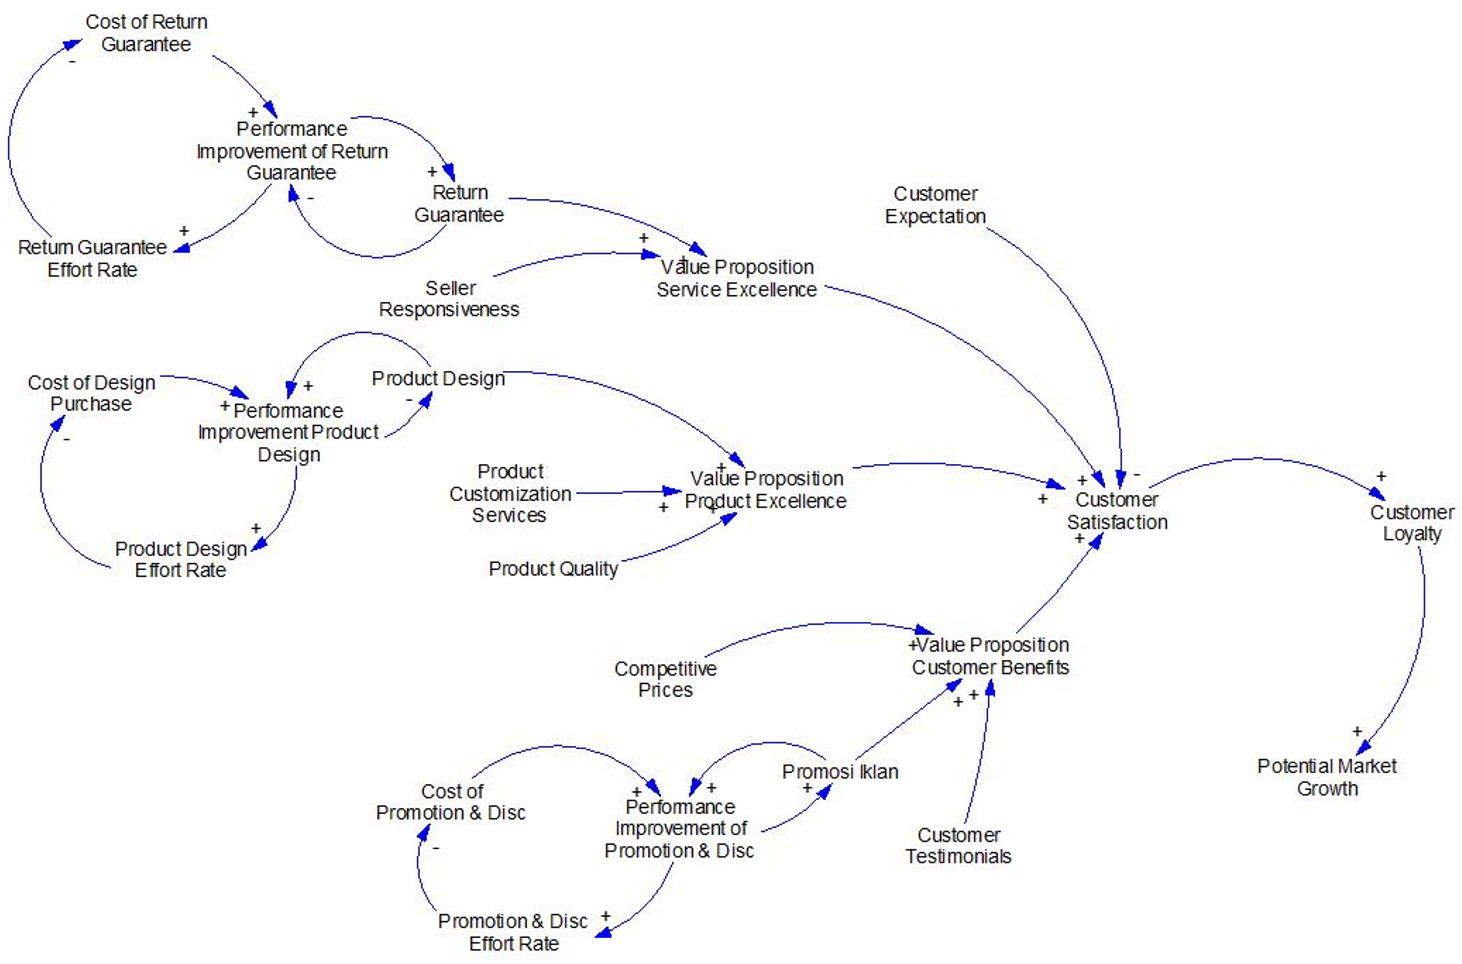
In the Value Proposition model, the CLD shows the interrelation between three variables, Return Guarantee, Product Design and Promotion & Discount. These three variables are the main components to improve the Value Proposition. The diagram also shows the effect of increasing Customer Satisfaction and the gap compared to Customer Expectation which together determine the Value Proposition score that comes from these three variables.
The Value Proposition score is a key element, a higher score means there is a higher potential to increase Customer Loyalty. Finally, this increase in customer loyalty supports the Potential Market Growth which is a key expectation of SMEs. The efforts to improve the Value Proposition (cost allocation) impact on the effort rate and are directed at optimizing the performance of the Value Proposition based on the results of the IPA analysis. Hence, the association between Value Proposition, Customer Loyalty and Potential Market Growth is a strategic cycle in decision making through Return Guarantee, Product Design and Promotion & Discount variables.
Stock and Flow Diagram (SFD) Value Proposition
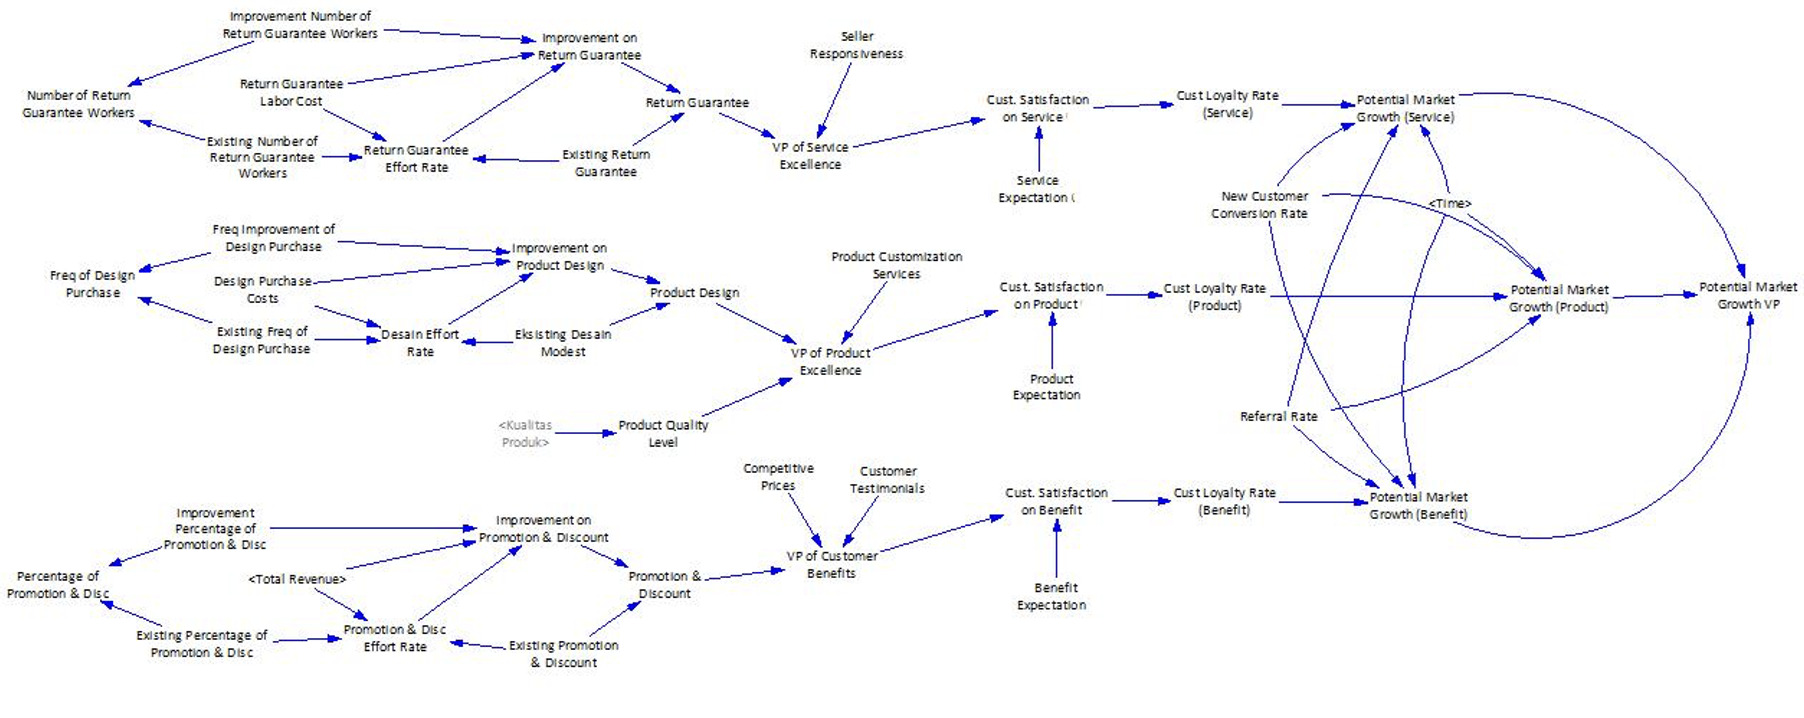
The SFD is a graphical representation of the system operations by illustrating the relationship between stocks and flows that lead to the changes in variables over time. This study intends to provide a holistic view of the system operation including the interaction among components and the policy effects. The SFD model is used to run simulations that evaluate trends in stocks, the sensitivity to key variables and alternative policy scenarios. The results are summarized in tables that compare stock and flow values for the different time periods and scenarios that allow the identification of critical points, the influence of the parameters and strategic recommendations. Therefore, SFD analysis and its interpretation provide a solid basis for data-driven decision making in this research context. The SFD (Figure 2) captures the key variables that influence the value proposition:
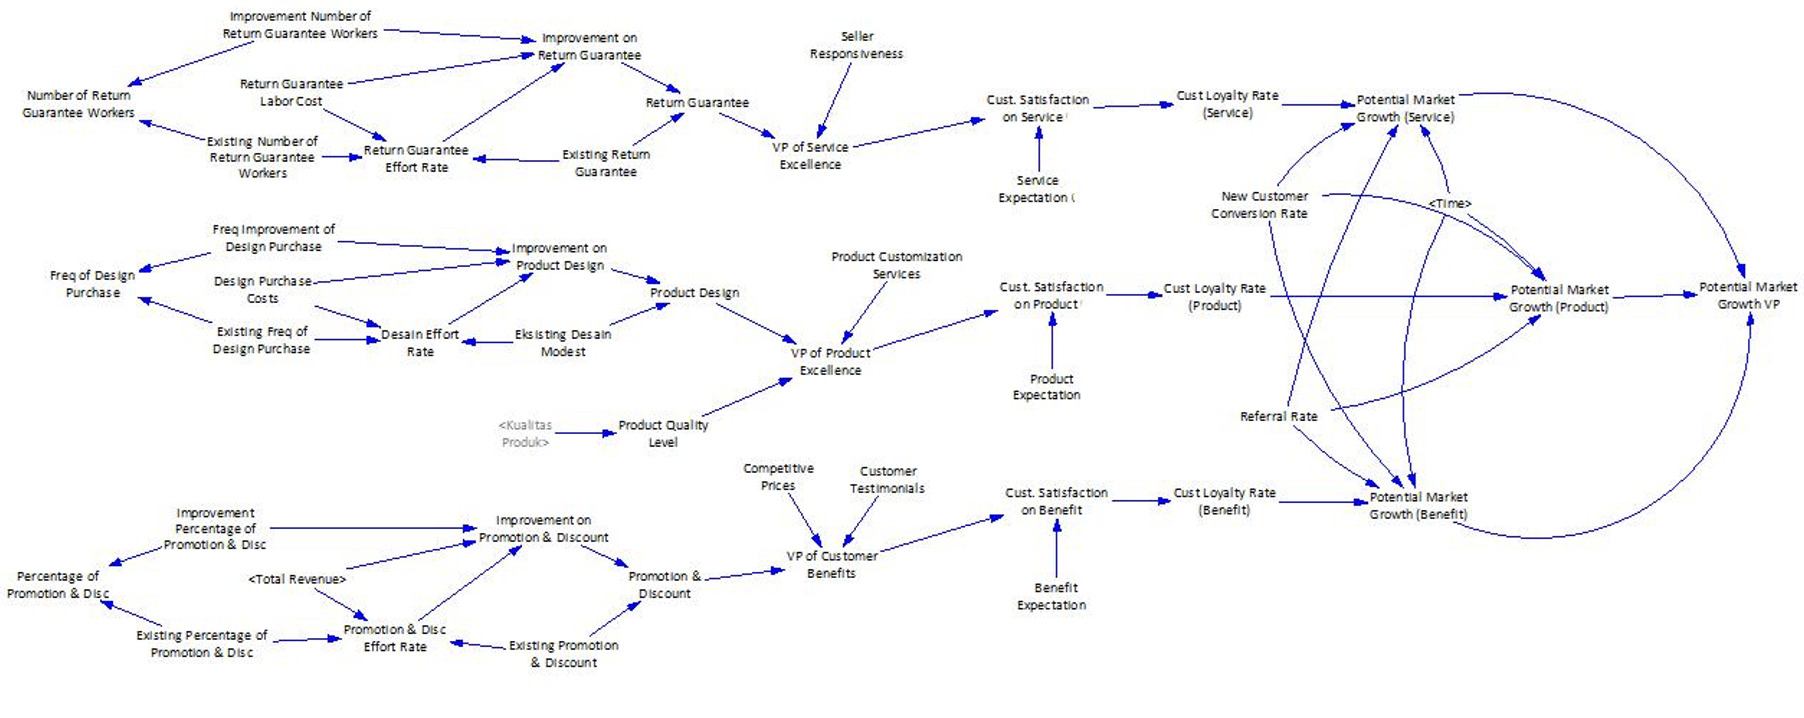
The following are the important variables in SFD that significantly contribute to increasing value proposition, customer loyalty and potential market growth.
-
Return Guarantee: Efficiency in handling product returns.
-
Product Design: Update frequency in line with market trends
-
Promotion & Discount: Allocate budget for greater reach and market penetration.
Table 5 SFD Value Proposition remains the same and includes detailed definitions and equations for variables with an emphasis on dynamic relationships impacting customer satisfaction and market growth.
Analysis of SFD Model
-
Return Guarantee: Policies on product returns have a direct effect on customer loyalty. The focus of optimization is workforce expansion.
-
Product Design: Regular updates increase the appeal of products and customer satisfaction.
-
Promotions & Discounts: Strategic positioning of the promotion budget helps penetrate the market.
Variable linkage to value proposition
The Customer Loyalty Rate is the one indicator that connects many attributes (benefits, product quality, service, etc.) with the possibility of market growth. The market expansion is directly proportional to the improvements of these attributes.
Model Validation Results
To ensure the reliability of the model, validation was performed by comparing the simulation results with actual data. The error levels (E1 and E2) were within the required thresholds, showing the validity of the model.
-
Validation of New Customer Conversion Rate Variable
The validation results in Figure 4 show that the error rate is 0.00%, meeting the criteria of E1<5% and E2<30%.
-
Referral Rate Variable Validation.
Validation confirmed a 0.00% error rate confirming the robustness of the model.
Scenario Development for Value Proposition Simulation
The IPA mapped out the key variables influencing the Customer Loyalty Rate and Potential Market Growth. Simulation Results for the Value Proposition Model gives an insight for various scenarios.
Simulation Results and Potential Improvements
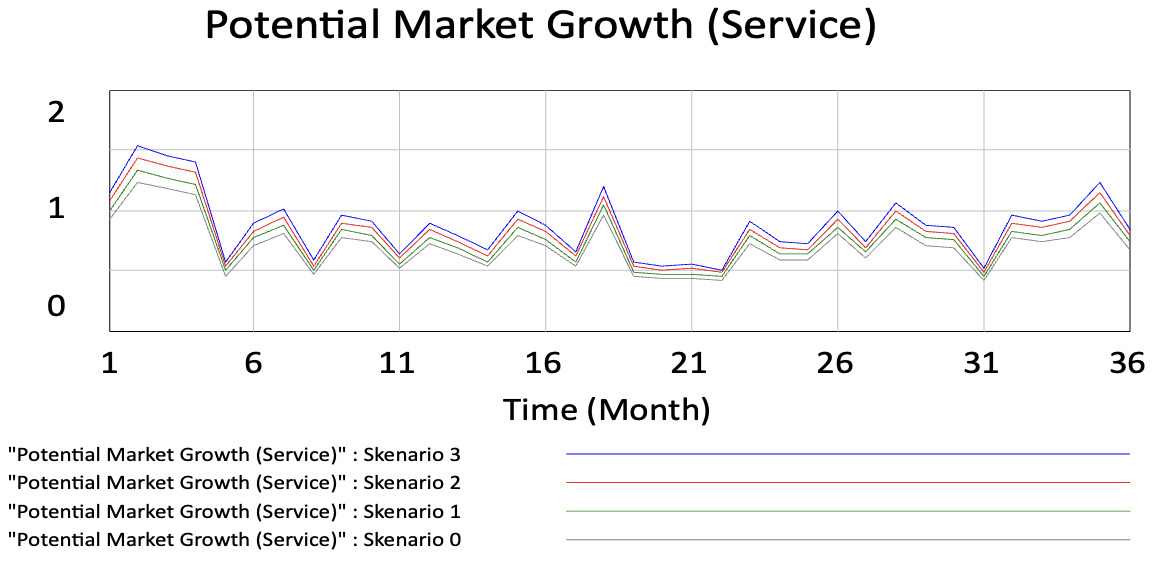
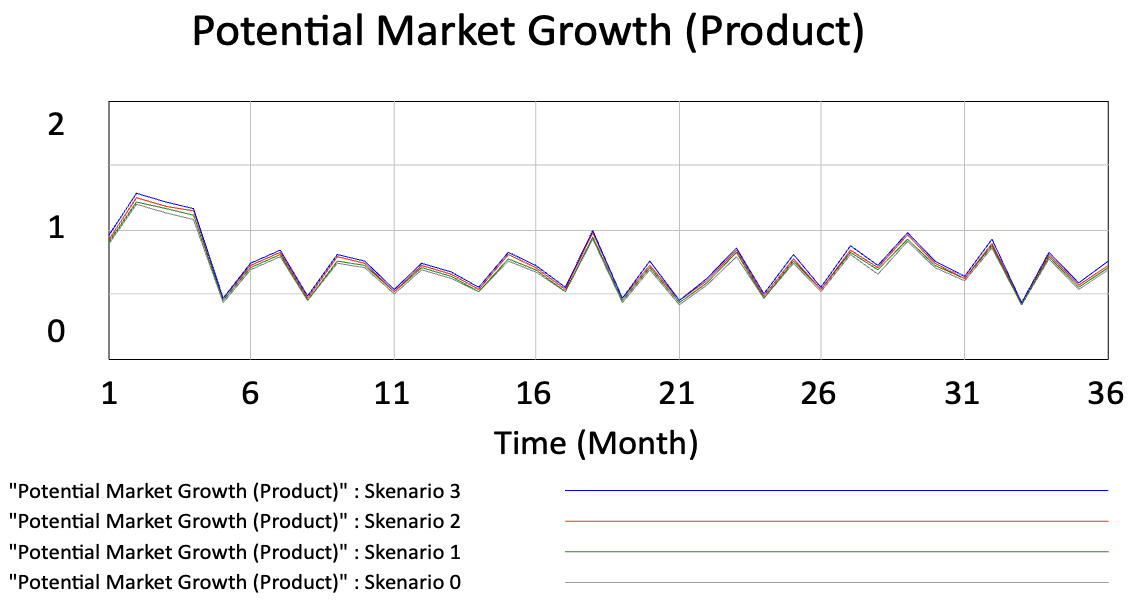
Simulation was done based on the SFD results to understand the effect of three important variables (Return Guarantee, Product Design and Promotions & Discounts) on Potential Market Growth. The simulations are designed to test the feasibility and effectiveness of different improvement scenarios, with emphasis on cost effective approaches that would support the company’s objectives.
The findings highlight the necessity of matching investment with projected market growth in order to achieve a sustainable improvement in the value proposition of the SME. Detailed results and strategic implications of each variable are as follows:
-
Return Guarantee
The simulation results show that the addition of one worker to the process can significantly improve the efficiency of the process with a Potential Market Growth of 8.18%. The benefits achieved for the low cost make this scenario quite feasible.
The improvement is expected to bring 4,530 new customers with an additional revenue of Rp670,500,000 and is a cost effective and impactful strategy. One worker added that it was low risk.
-
Product Design
Increasing product design update frequency to 12 times a year increases the Potential Market Growth by 5.40%. This is a compromise solution for the distribution of forces and improving efficiency. This corresponds to the market situation and needs of customers.
Scenario is feasible and effective, expected to attract 2,991 new customers with potential revenue Rp448,650,000, 12 times the design frequency for low risk.
-
Promotion & Discount
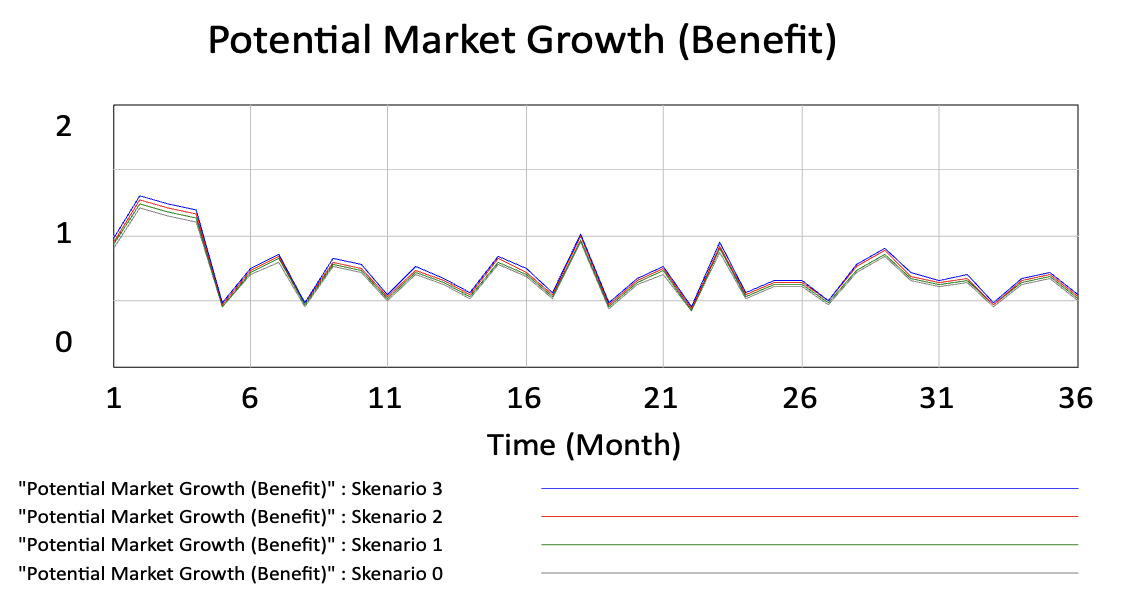
A promotion budget of 12% of revenue offers the highest potential market growth of 7.74% but this is not feasible due to the disproportionately high cost to benefit ratio.
Despite the growth potential, the additional cost of Rp382,459,375 makes this scenario infeasible from the cost-benefit perspective. However, the 12% advertising increase is seen as high risk.
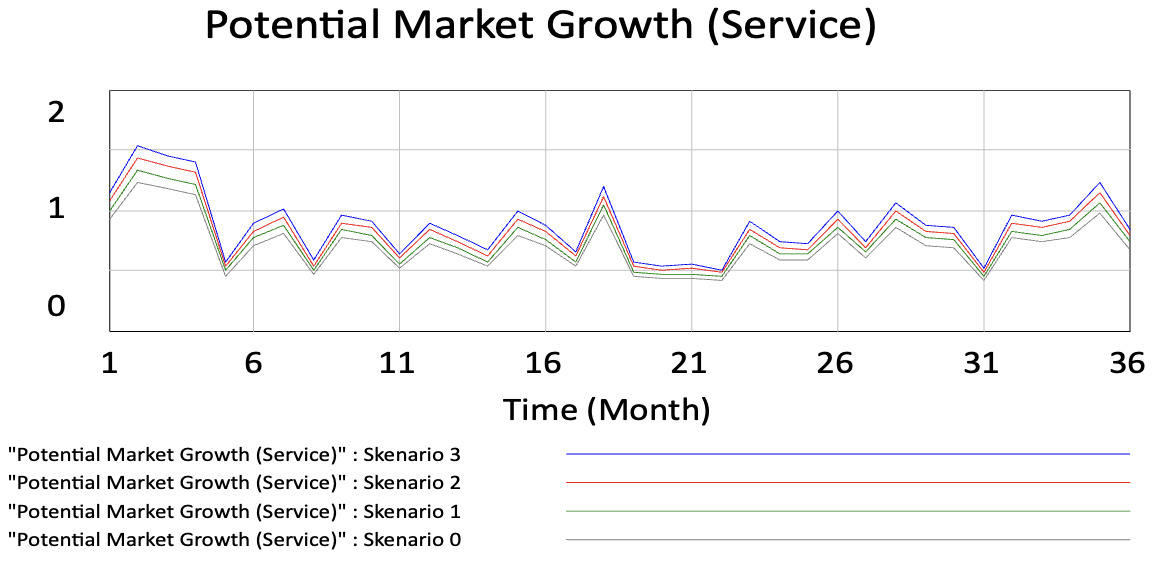
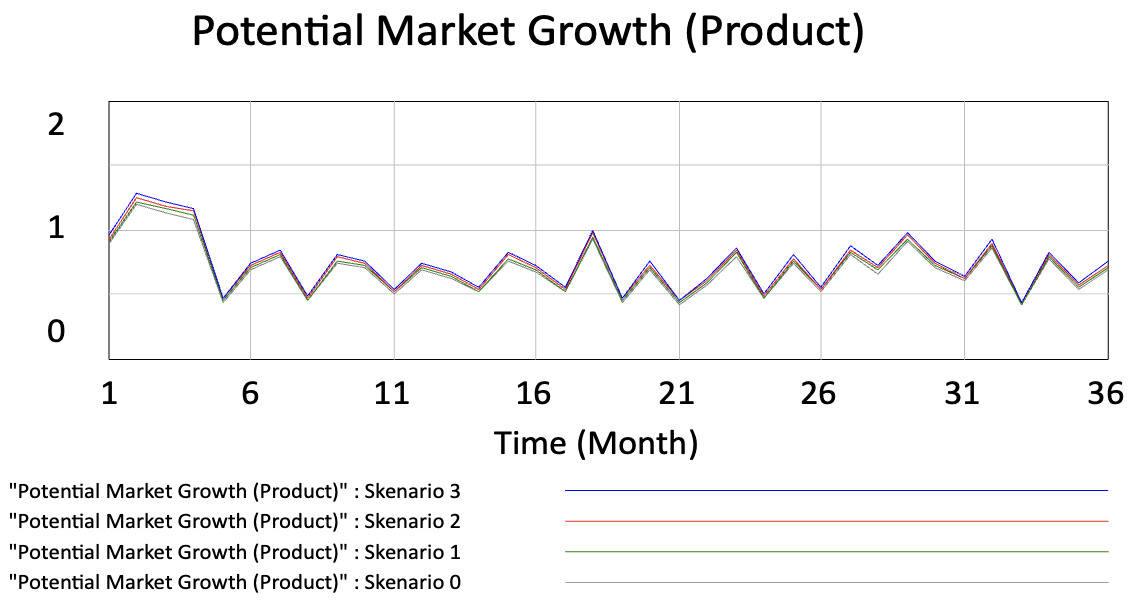
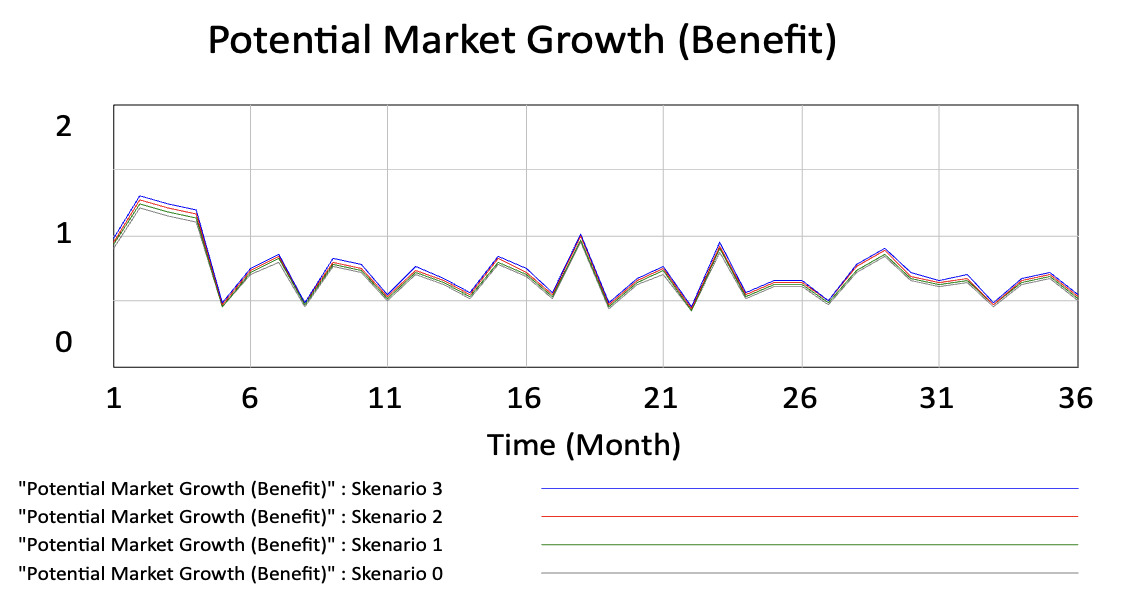
Analysis of the results of the SFD allows one to construct scenarios simulating the variables influencing the value proposition. These scenarios are based on a detailed analysis of three main variables that significantly contribute to the Customer Loyalty Rate and impact The Potential Market Growth. The three variables are Return Guarantee, Product Design and Promotion & Discount.
When seeking to improve and optimize the performance of the value proposition, the degree of feasibility should be considered, i.e. (1) if the improvement proposed can be effectively implemented by the company, and (2) if the cost-benefit analysis shows an appealing ratio. The comparison of cost and benefit is a key consideration to assess the feasibility of each optimal alternative obtained from the simulation results for each scenario.
The best outcome is Scenario 1, where the value proposition is enhanced by guarantees of return, which is calculated from five simulation scenarios. This means adding one employee with an annual cost of around IDR 32,500,000. This improvement is expected to lead to a potential market growth increase of 8.18%. It is estimated to produce additional 4,530 customers. It will boost sales revenue by IDR 670,500,000. This initiative can be considered viable in terms of the feasibility of cost-benefit analysis. Table 12 below gives simulation scenarios for optimization of each variable.
In the simulation with product design variables, the best scenario was found to be Scenario 2, which is adding two product designs per year. This effort will incur an additional cost of IDR 6,000,000 and is expected to increase potential customer growth by 5.40%. This growth is expected to add 2,991 customers, generating an increase in sales of IDR 448,650,000. The feasibility results of improving the value proposition through better product design are considered as feasible.
The best result was achieved in Scenario 3 with the intervention on the promotion and discount variables to reinforce the value proposition, using dynamic simulation. This involves increasing the promotion and discount budget by 3%, from 9% to 12%. The additional cost of IDR 382,459,375 for promotions and discounts is expected to increase the growth of potential customers by 7.74%. Thus, this would lead to an additional 4,287 customers with additional revenue estimated to be IDR 643,050,000. Even though, the feasibility results for strengthening the value proposition through promotions and discounts are considered as unviable, as the additional costs represent 59% of the estimated revenue.
Strategic Recommendations
- Concentrate on Doable Enhancements:
-
Focus on improving the efficiency of return guarantee by adding one worker (Scenario 1)
-
Increase the product design frequency to 12 times a year (Scenario 2).
- Plan Promotions Strategically:
- Evaluate various promotion strategies to optimize the cost and growth impact without exceeding the budget
SMEs can incorporate these insights into its decision-making process to improve its value propositions effectively, meet the customer expectations, and attain sustainable growth in the market.
Discussion
The value proposition is one of the central elements of the BMC. It defines the core value that a business provides to its customers (Osterwalder et al., 2014). This value is the main reason that customers prefer a company’s products or services to those of a competitor. The value proposition is examined in this study using a customer survey and the IPA method to determine the most important elements of the value proposition and those that require improvement. The research novelty is this approach that combines customer perception analysis with the performance evaluation of business elements.
Based on the IPA analysis, three indicators of value proposition were found to be of high importance and low performance and are considered to be the priority areas for improvement. This result is in line with previous research (Martilla & James, 1977; Ormanović et al., 2018) that emphasizes the importance of understanding customer needs in the development of successful business strategies. However, the application of IPA in the context of SMEs is relatively rare and therefore this study is a novel contribution to the SMEs management literature.
The next step was to design alternative strategies to improve the value proposition through system dynamics simulation (Lafuente et al., 2020; Sánchez-García et al., 2023). This simulation approach allows researchers to assess different improvement scenarios in terms of implementation feasibility and risks. The proposed solutions were designed to fit the current conditions of the SMEs as well as the research assumptions that delimit the scope of the study, thus ensuring the applicability and relevance of the results. The simulation model is informative for the present case study but can also be further developed in future research to increase its representativeness.
Moreover, the model can be adapted for other SMEs with similar characteristics, thus enabling a broader generalization of the research findings. Therefore, the integration of IPA and system dynamics simulation in enhancing the value proposition can serve as a strategic reference for the sustainable development of SMEs businesses.
Conclusions
This study offers a holistic approach to optimization of value propositions in SMEs through integration of IPA, system dynamics modeling, and feasibility assessment. The analysis showed that priority areas such as product design, return guarantees, promotions and discounts are high importance but low performance areas and should be strategically addressed. The IPA model identified these attributes as important for improving customer satisfaction and competitiveness.
SFD simulation results showed that increasing the workforce capacity to manage the return guarantees significantly improved the efficiency of the process, resulting in an increase of 8.18% in the potential market size, at a relatively low and feasible cost. Likewise, by designing product updates 12 times a year, the potential market size increased by 5.40% in line with customer expectations and ensuring cost efficiency. Despite the market growing by 7.74%, it was decided that raising the promotional budget to 12% of the total revenue was not financially viable, as the costs outweighed the benefits.
The suggested approaches based on these results are to focus mostly on cost effective improvements in return guarantees and product design upgrades. SMEs should explore other channels of promotions and discounts that would provide a cost-benefit balance to sustain market growth. The study also highlights the importance of using IPA in conjunction with system dynamics modelling as a data-driven approach to decision-making, assisting SMEs in effectively distributing resources and matching their offerings to customer expectations.
However, the study is limited to a digital fashion SME X, and future research can apply the proposed framework to other industries to validate its scalability and generalizability. In addition, qualitative customer feedback can be incorporated to improve the analysis and strategies, providing further insights on how to optimize value propositions. The paper proposes a new method of incorporating data from a scientific questionnaire into quantitative analysis, based on simulation techniques. It also includes decision-making processes trying to optimize value propositions considering both risks and feasibility.
Theoretical Implication
This study makes a significant contribution to the development of the value proposition concept and analytical approaches in the management discipline. First, it connects value proposition testing and the IPA method through customer surveys. This approach is novel as these two concepts have been investigated separately in the previous research. The integration leads to a value proposition that is immediately validated by customers, thus increasing the relevance and accuracy of the concept in addressing real consumer needs.
Second, this study establishes a system dynamics model to represent the value proposition as a system that drives customer growth. The model uses survey data and other quantitative data in mathematical equations which are used to develop an SFD within the system dynamics framework. This approach contributes to the literature by providing a more holistic understanding of the value proposition from a systemic and dynamic perspective.
Thirdly, the new method is proposed by adding risk levels and feasibility analysis in evaluation process. By considering risk factors in the feasibility assessment of alternative solutions for value proposition enhancement, more optimal and realistic recommendations are possible. It contributes to the theoretical debate on risk management and feasibility studies, especially in terms of the development of value propositions that focus on sustainability and effectiveness of implementation.
Practical Implication
The research model developed in this study may be regarded as a strategic reference for SMEs to improve their value proposition and gain customers in highly competitive markets. The IPA approach is used to measure the importance and performance level of the different elements offered to the customers thus the SMEs can identify and prioritize the key areas of improvement.
This research provides practical implications for SMEs to focus on elements like return guarantee and product design to enhance their value proposition as they have been proved to significantly influence customer satisfaction and loyalty. Furthermore, the model includes considerations of risk and feasibility in the evaluation of alternative solutions, including both cost and benefit aspects. This allows SMEs to choose more optimal and realistic strategies for implementation.
To use the proposed model effectively it is necessary to reconsider the research assumptions and limitations and make sure they are in compliance with the real system conditions. The results of this study can be used as a decision support tool for the improvement of value proposition strategy. Future model development may consider inclusion of more contextually relevant variables consistent with the dynamic nature of SMEs operations.